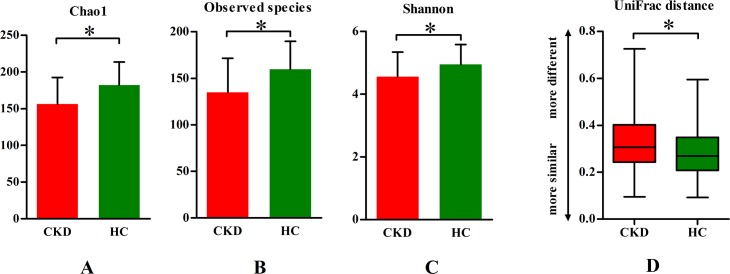
Fig 1. Microbial diversity comparisons between hemodialysis and healthy control group.
(A, B, C) Chao1, Observed species and Shannon (α diversity), representing community richness were compared between groups for supragingival plaque. (D) The average weighted UniFrac distance values (β diversity) of supragingival plaque in the two groups. CKD: chronic kidney disease, HC: healthy control. t-test or Wilcoxon Rank Sum test, *P < 0.05.

