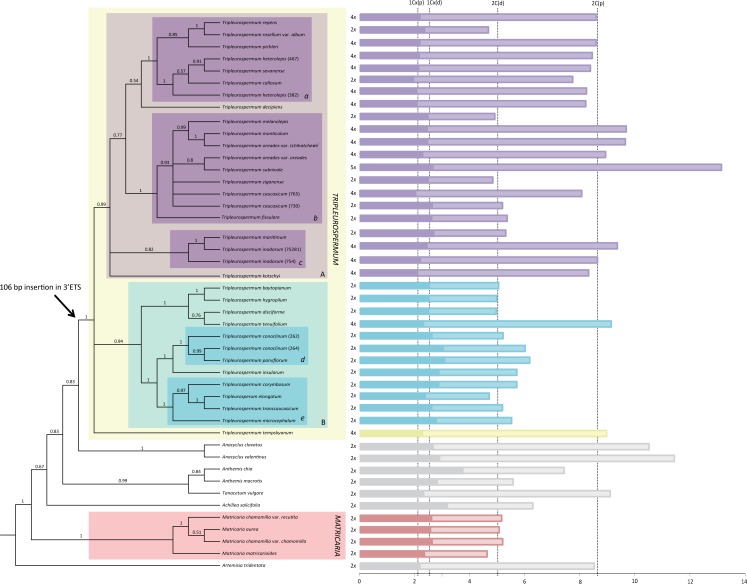
Fig 2. Molecular phylogenetic reconstruction obtained through combined analysis of ITS and 3’ETS sequence data for 45 taxa.
The majority rule consensus tree (50%), based on Bayesian MCMC inference and with Bayesian clade-credibility values (posterior probability > 0.5) above branches, is displayed. A representation of genome sizes in bars (2C and 1Cx, in darker colours) is displayed in the right part of the image. Note, average higher genome sizes of species from clade A (purple) as compared to species from clade B (blue) in Tripleurospermum.

