Fig 2.

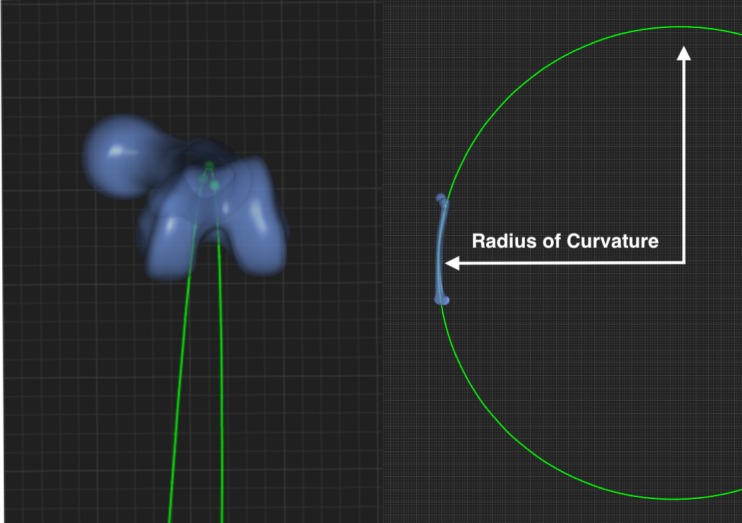
(left) shows an axial view of the femoral curvature as a section of the created 3D circle; the plane centres are represented by green dots–(right) shows the femur, portraying one section of the created 3D circle which was used to measure ROC.

(left) shows an axial view of the femoral curvature as a section of the created 3D circle; the plane centres are represented by green dots–(right) shows the femur, portraying one section of the created 3D circle which was used to measure ROC.