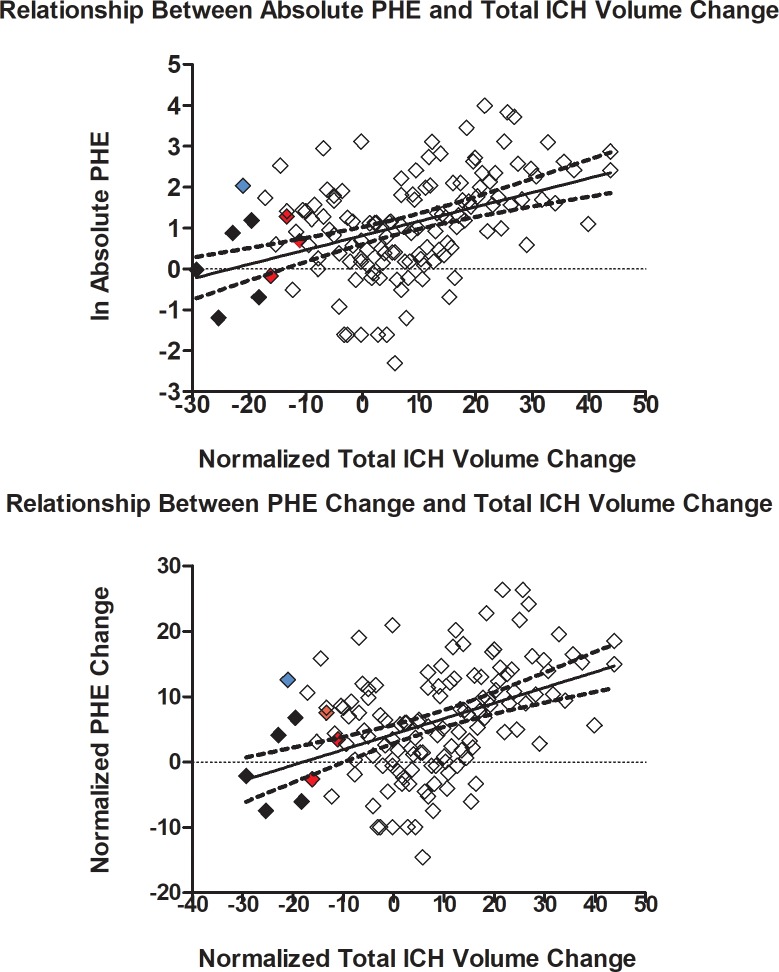
Fig 3. Top: Linear regression plot of normalized total ICH volume change and absolute PHE (R = 0.424, 95% CI [0.275, 0.553], p = 0.0001).
Bottom: Linear regression plot of normalized total ICH volume change and normalized PHE change (R = 0.425, 95% CI [0.276, 0.554], p = 0.0001) The solid diamonds represent HR patients by absolute (blue), percent (red), and both (black) criteria.

