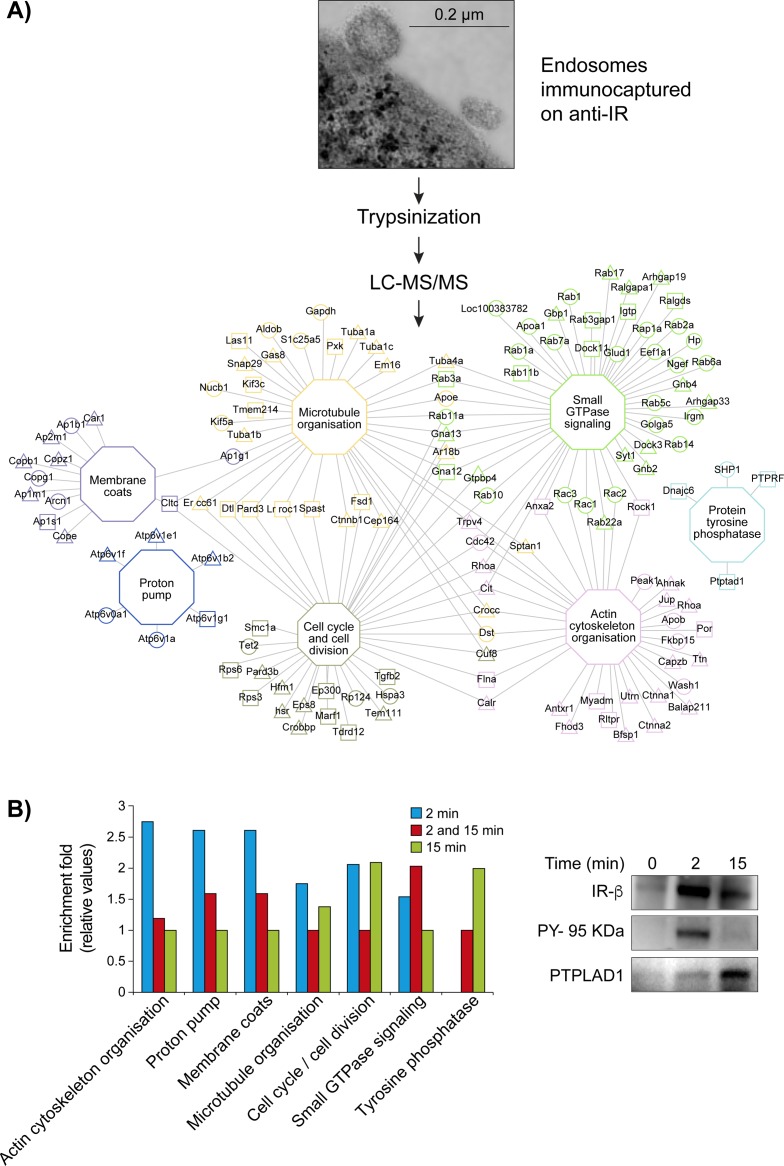
Fig 1. Network of enriched cellular processes in IR-containing endosomes.
(A) Workflow of network construction: Inbound endosomal proteins (IREP) were classified into major functional groups according to the MGI database and using the tool BINGO. The triangles (2 minutes) and the squares (15 minutes) are indicative of the insulin post-injection time before endosomal preparation. The circles indicate proteins identified at both times. The hexagonal nodes and their respective border paints represent the functional groups associated linked proteins. Proteins associated with more than one functional group have the border paints of the most statistically significant functional group (S1 Table). (B) (left panel), Comparative enrichment profiles of trafficking proteins according to the insulin post-injection time. (right panel), the bound fraction (equal amount of starting material, see methods, S1 Fig) was blotted and pieces were incubated with antibodies against IR (95 kDA β-subunit), phosphotyrosine (PY-20, PY-95 kDA) and PTPLAD1.

