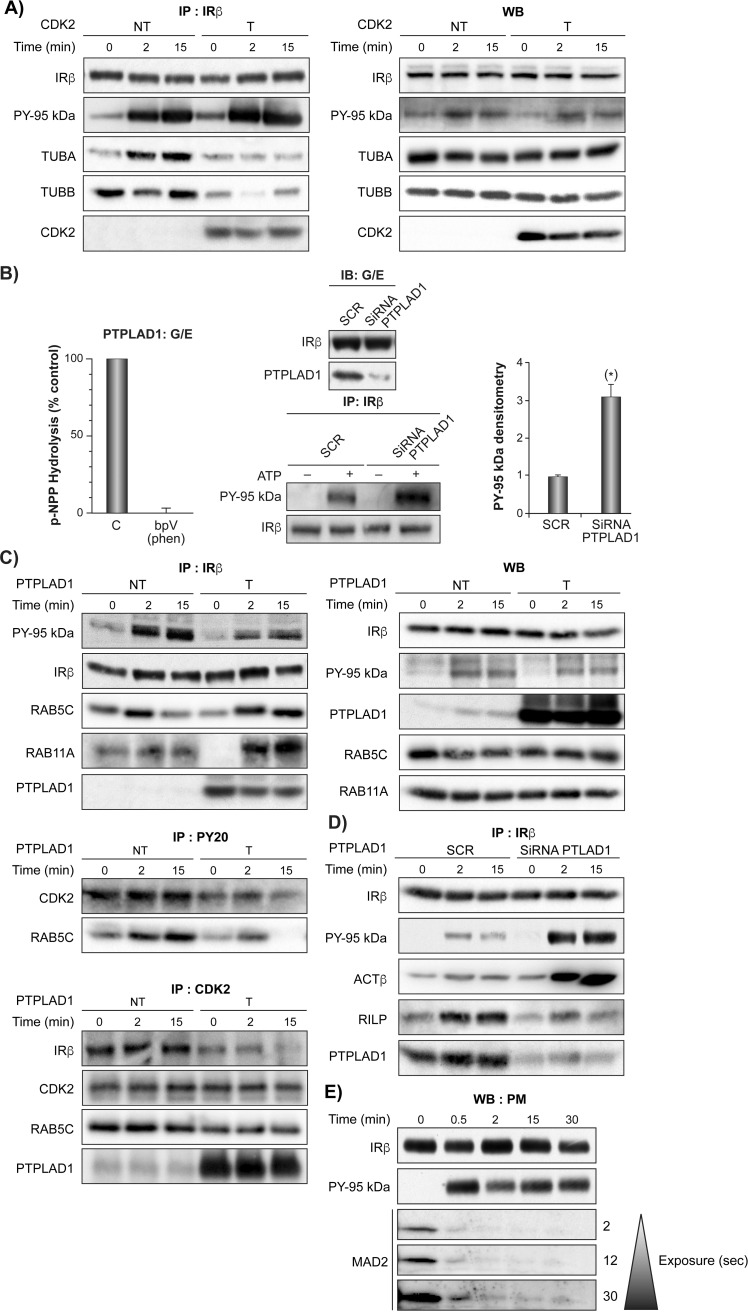
Fig 4. Cdk2 and PTPLAD1 interact with IR complex organization.
(A) HEK293 cells were transfected with pcDNA3-Cdk2 (T) or pcDNA3 (NT) for 48 hours. They were preincubated in serum-free medium for 5 hours and then stimulated for the indicated times with insulin (35 nM). Proteins were resolved by SDS-PAGE and were blotted for the indicated proteins. The autoradiograms depict data from a typical experiment. Statistical values for salient time points are mean ± s.d. of % of initial densitometric values (two-tailed unpaired Student’s t-test). Left panel: IR immunoprecipitation (IP: IRβ), IR autophosphorylation (PY 95 kDa) and Cdk2, TUBA and TUBB presence. TUBA: NT 0 vs 2 min: Fold increase, 45 ± 7.5, n = 3, p ≤ 0.001; TUBB: NT 0 vs 2 min: Fold decrease, 55 ± 8, n = 3, p ≤ 0.001). Right panel: Immunoblots (WB) of CDK2, IR-β-subunit, TUBA, B (pieces of the same membrane except PY-95 kDa (PY20 antibody); 3 independent experiments). (B) IR autophosphorylation increases in isolated endosomes depleted of PTPLAD1. Right panel: Rats were injected with a scrambled (SCR) or siRNA oligonucleotide targeting PTPLAD1 for 48 hours. The G/E fractions were then prepared from livers at their IR concentration time-peak (2 minutes after insulin injection; 1.5 μg/100 g, b.w.). The presence of IR and PTPLAD1 was verified by immunoblot (IB: G/E, input 50 μg of protein, pieces of the same membrane). IR immunoprecipitation (IP: IR0β) and IR autophosphorylation (PY 95 kDa) were measured after suspending endosomes in a cell-free system in the presence of ATP for 2 minutes at 37 oC. After stopping the reaction, autophosphorylation was detected by immunoblotting using an anti-phosphotyrosine antibody (PY20). Normalized values shown in the right panel are means ± s.d. (* P<0.001 n = 3). Left panel: PTPLAD1 was immunoprecipitated from the same fractions (input 30 mg protein of solubilized G/E) and incubated with p-NPP in the presence or absence of 50 μM bpV(phen). The measured activity was expressed as a percentage of 0.55 +/- 0.8 mmoles/min/mg of cell extract, n = 4. (C) Cells were transfected with PTPLAD1-pcDNA3 (T) or pcDNA3 (NT) for 48 hours, incubated in serum-free medium for 5 hours and then stimulated for the indicated times with insulin (35 nM). The panel on the right shows immunoblots from the total cell lysates. Left panel, IPs of IRβ, phosphotyrosine (PY20 antibody, middle left), and Cdk2 (bottom left). IPs IRβ: Rab5c: NT, 0 vs 2 min: Fold increase, 250 ± 45, n = 3, p ≤ 0.001; 0 NT vs 0 T: Fold decrease 45 ± 9.5, n = 3, p ≤ 0.01); 15 NT vs 15 T: Fold increase 310 ± 35, n = 3, p ≤ 0.001). IPs Cdk2, Rab5c: 0 NT vs) T: Fold decrease 52 ± 7.5 n = 3, p ≤ 0.01). (D) PTPLAD1 siRNA knockdown. IPs of the IR β, ACTβ: 0 vs 2 min Si RNA PTPLAD1, Fold increase 420 ± 47, n = 3, p ≤ 0.001; RILP: 0 vs 2 min SCR, Fold increase 325 ± 35, n = 3, p ≤ 0.001 (E) The plasmamembrane (PM) fractions were prepared from rat liver at the indicated time following the injection of insulin (1.5 μg/100 g b.w.). Fractions were monitored for the PM-associated MAD2 by immunoblotting (50 μg proteins).

