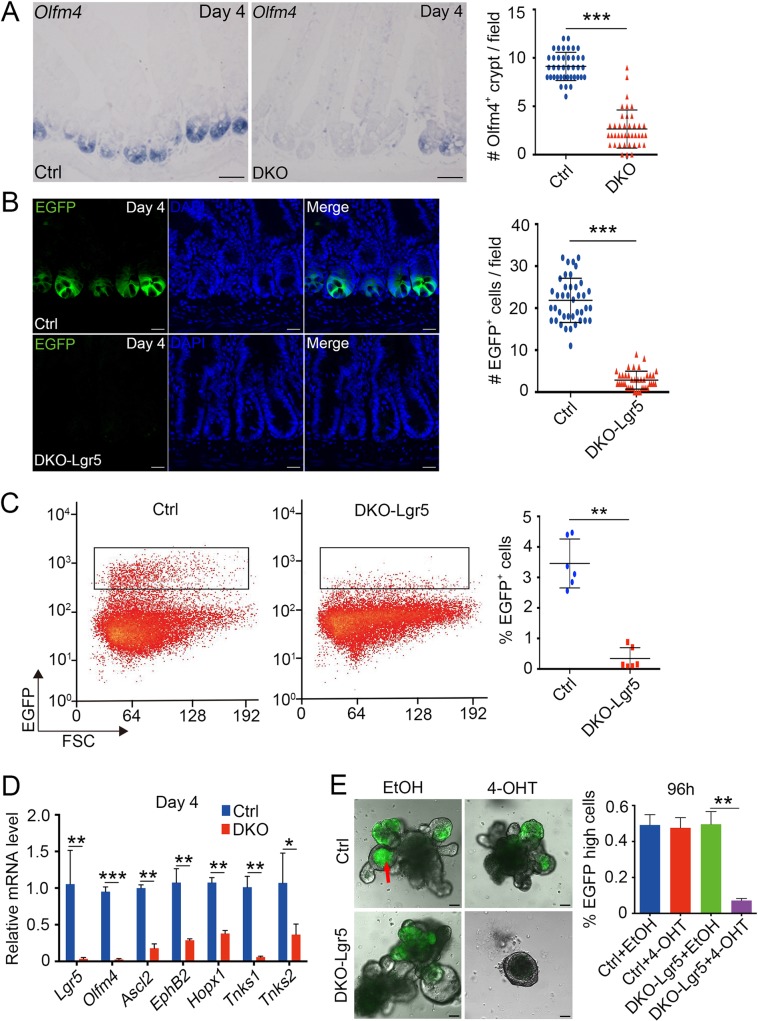
Fig 3. Ablation of TNKSs reduces intestinal Lgr5+ stem cells.
(A) In situ hybridization analysis of intestinal stem cell marker Olfm4 expression in small intestine sections of control and Tnks DKO mice at day 4 after the first TAM injection. Left panel: Representative images from 4 mice of each genotype are depicted. Scale bar: 50 μm. Right panel: Quantification of the Olfm4 positive crypts of the indicated adult mice (n = 4). 40 fields were scored for each condition. (B) Lgr5-EGFP-expressing cells in proximal jejunum sections of Ctrl (Lgr5-EGFP-IRES-creERT2) or DKO-Lgr5 (Lgr5-EGFP-IRES-creERT2;Tnks1-/-;Tnks2fl/fl) mice at day 4 after the first TAM injection. Cell nuclei were counterstained with DAPI. Left panel: Representative images from 4 mice of each genotype are depicted. Scale bar: 50 μm. Right panel: Quantification of the GFP-positive cells of the indicated adult mice (n = 4). 40 fields were scored for each condition. (C) FACS analysis of Lgr5-EGFP-positive ISCs from small intestine crypt of the mice at day 4 after first TAM injection. Right panel: Quantification of EGFP+ cells of the indicated adult mice (n = 6). (D) Crypts of indicated mice (n = 3) at day 4 after the first TAM injection were isolated for qRT-PCR analysis of intestinal stem cell marker gene expression. (E) Organoids derived from the crypts of mice in (B) were treated by vehicle (EtOH) or 4-OHT. Left panel: Representative images were taken at 96h, from 5 independent experiments. Scale bar: 100 μm. Notes: Red arrow indicates autofluorescence in the organoid lumen. Right panel: Quantification of Lgr5-EGFP-high cells. Data from 5 independent experiments are represented as mean ± SEM, analyzed by unpaired Student’s t-test. **P<0.01. Data (A, B, C and D) are represented as means ± SD, analyzed by two-way ANOVA test. *P < 0.05, **P < 0.01, ***P < 0.001.

