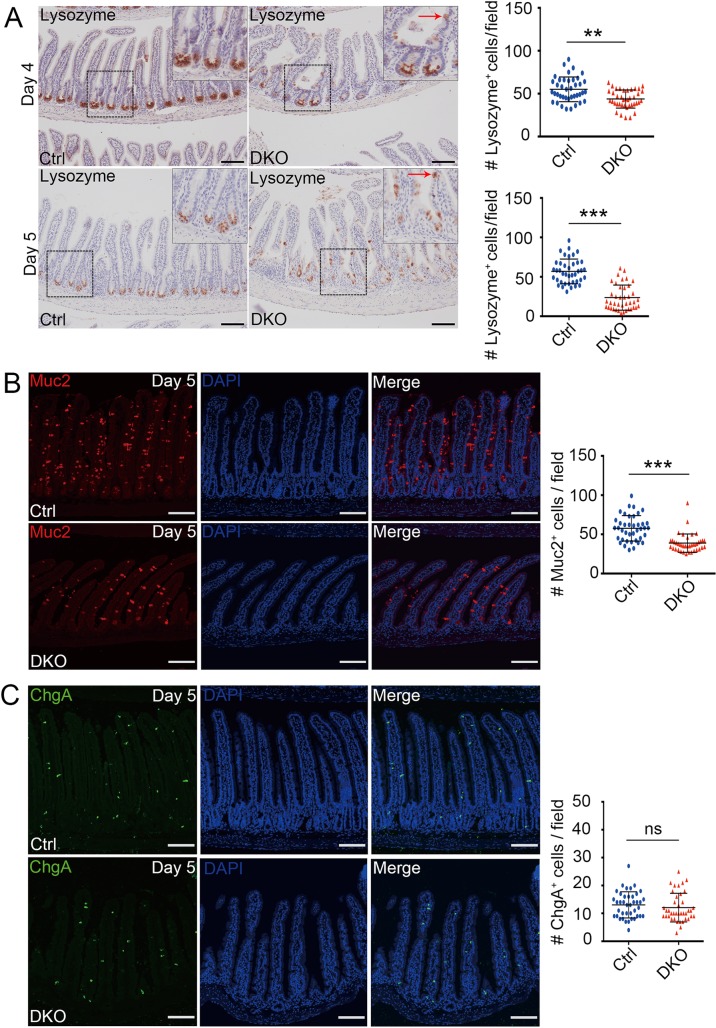
Fig 4. Decrease of Paneth cells and goblet cells in small intestine upon deletion of TNKSs.
(A) Histological analysis of Paneth cells by lysozyme staining in mice at day 4 and 5 after the first TAM injection. Representative images from four mice of each genotype are depicted. Notes: Red arrow indicates dislocated Paneth cells. Scale bar: 100 μm. Right panel: Quantification of Lysozyme+ cells (n = 4 mice). (B, C) Mucin 2 (B) or Chromogranin A (C) immunofluorescence staining of small intestinal sections from mice on day 5 after the first TAM injection. Cell nuclei were counterstained with DAPI. Scale bar: 100 μm. Right panel: Quantification of goblet cells (B) or enteroendocrine cells (C) from 40 fields scored for each condition (n = 4 mice). Data are represented as means ± SD, analyzed by two-way ANOVA test. **P < 0.01 and ***P < 0.001.

