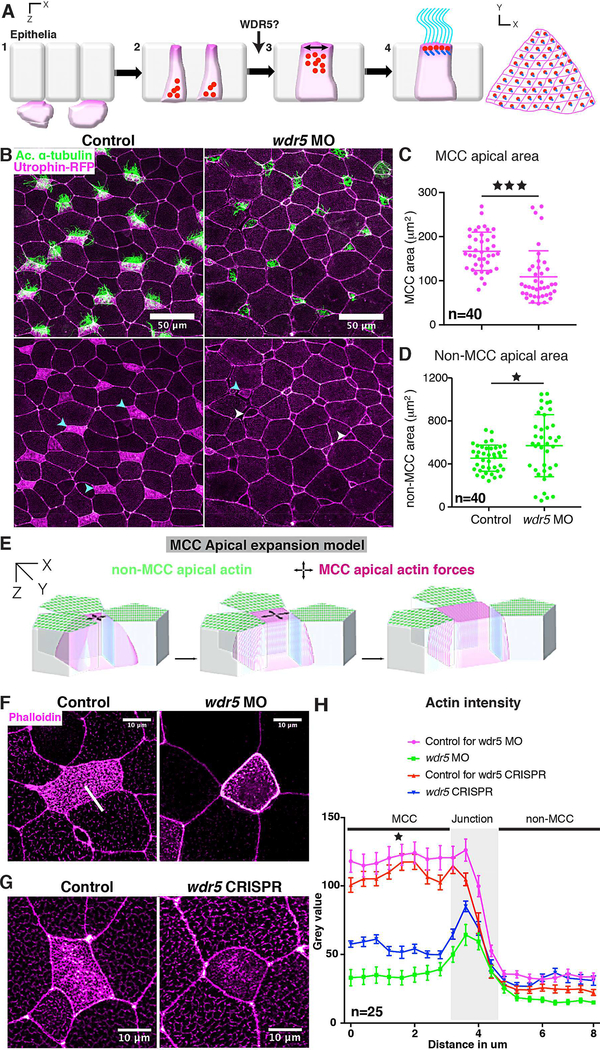
Figure 4: Wdr5 is essential for apical expansion and actin assembly in ciliated cells.
(A) The four steps of ciliogenesis in MCCs with emphasis on the role of WDR5 during the third step of MCC formation.
(B) Xenopus epidermal MCCs marked with anti-acetylated α-tubulin (green, cilia) and utrophinGFP (magenta). Cyan and white arrowheads show ciliated cells with apical enrichment and loss of actin respectively.
(C, D) Apical area of MCCs (C) and non-MCCs (D) in controls and wdr5 MO injected embryos. n = number of MCCs.
(E) Model representing actin dependent apical surface expansion in MCCs.
(F, G, H) Quantitative analysis of apical enrichment of actin in MCCs and neighboring nonMCCs in controls and (F) wdr5 MO or (G) wdr5 CRISPR injected embryos. Actin enrichment was quantified (H) using a line scan (white line) spanning MCC and neighboring non-MCC. Actin was stained using phalloidin. n = number of MCCs.
★ and ★★★ indicate statistical significance at P < 0.05 and P < 0.0005. Data are represented as mean ± SEM.
See also Figure S5 and S6

