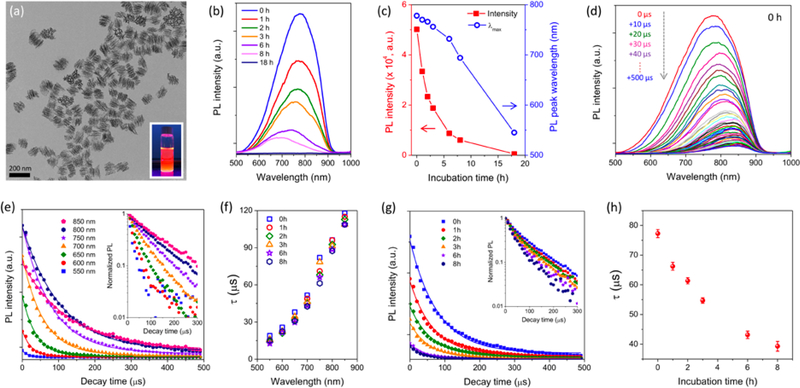
Figure 1. Evolution of photoluminescence characteristics of PSiNPs during dissolution.
(a) Transmission electron microscope (TEM) image of PSiNPs. Inset: photograph of PSiNP solution under UV irradiation (λex: 365 nm). (b) Time series of steady-state PL emission spectra (λex: 365 nm) of PSiNPs incubated in PBS (pH 7.4, 37 °C), and (c) intensity (red solid squares) and wavelength (blue open circles) of the emission maximum as a function of incubation time. (d) Family of time-resolved PL emission spectra from PSiNPs in PBS, measured at 10 μs increments post-excitation. Spectra were obtained immediately after dispersion of PSiNPs in PBS, corresponding to the 0 h sample in (b). (e) Time-resolved PL emission decays taken from the family of emission spectra in (d). Each trace represents PL intensity as a function of time after the pulsed excitation, measured at the indicated emission wavelength. Inset: normalized PL decay trace presented on a log(intensity) scale, showing the increase in PL lifetime with longer emission wavelength characteristic of Si nanoparticles. A complete set of PL spectra and intensity decay plots for nanoparticles dispersed in PBS, measured periodically over a period of 18 h are given in Supporting Information, Figures S1 and S2. (f) The PL excited state lifetime, τ, plotted as a function of emission wavelength and measured after the indicated incubation times in PBS. The value of τ was obtained from single-exponential fits of the PL intensity-time traces (Supporting Information, Figure S2). (g) Total intensity of emitted PL from PSiNPs, integrated from the PL spectra over the wavelength range 500 –950 nm and plotted as a function of time immersed in PBS at 37 °C. The raw data are given in Supporting Information, Figure S1. Inset: normalized integrated PL intensity presented on a log(intensity) scale, as a function of time. (h) Corresponding integrated PL emission lifetime (τ) extracted from the integrated PL decay traces in (g). Because the decays were obtained from spectra integrated over the wavelength range 500 –950 nm, the τ values represent intensity-weighted average lifetimes for the entire ensemble of emitters in the PSiNP sample. The average PL lifetime decreases with increasing incubation time (n=3, error bars represent standard deviation).

