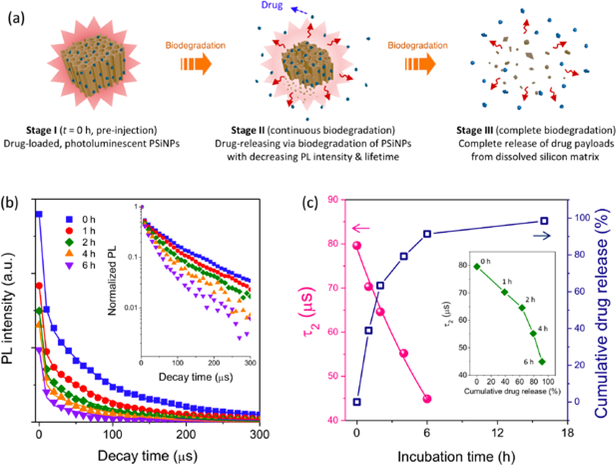
Figure 2. Self-reporting payload delivery based on photoluminescence lifetime from PSiNPs.
(a) Schematic illustration of the self-reporting release of drug from the PSiNP carrier. (b) Integrated PL (λem = 500–950 nm) of the peptide-loaded PSiNPs as a function time; the family of curves represent sequential measurements during degradation in PBS at 37°C. Each PL spectral decay was measured after a pulse of incident excitation (λex: 365 nm), and each trace represents a decay measured at the incubation times indicated. The fluorescence spectrum of the 6-FAM-labeled peptide payload in these nanoparticles overlapped with the PL spectrum of the PSiNPs (Figure S5a), and thus the integrated PL intensity showed a prompt decay component corresponding primarily to the short-lived fluorescence of 6-FAM. The PL decay τ2 which corresponds to the long-lived PL decay of PSiNPs is plotted. The PL decay traces measured after 6 h of incubation were of low intensity and did not provide reliable τ values. Inset: normalized PL intensitiy presented on a log(intensity) scale (c) Representative PL lifetime values for the τ2 component, obtained from the PL decays in (b), and the cumulative amount of peptide released from the PSiNPs, both measured as a function of incubation time. The supernatant was separated by centrifugation and the released peptide was quantified by measurement of the fluorescence intensity from the 6-FAM-label on the peptide (λex: 480 nm/λem: 520 nm). Inset: correlation of cumulative peptide released with PSiNP PL lifetime, measured during the course of PSiNP dissolution.

