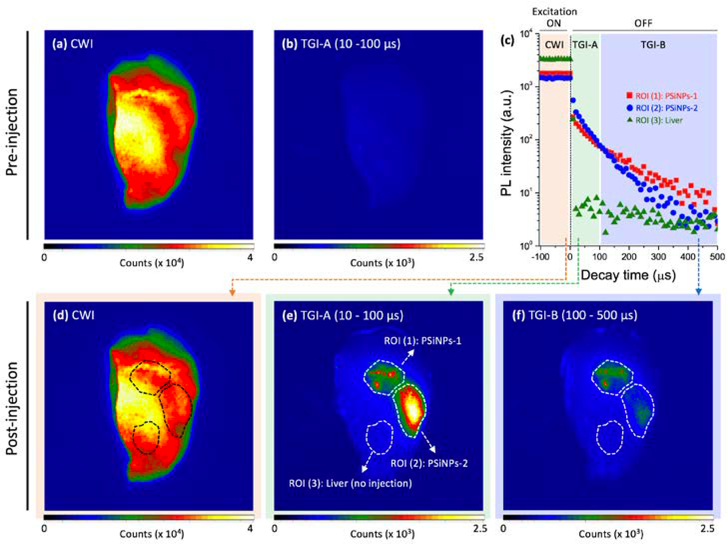
Figure 3. Continuous wave images (CWI) and time-gated images (TGI) of PSiNPs before and after localized injection into mouse liver tissue and analyzed ex vivo (𝜆ex = 365 nm, 𝜆em > 460 nm, using a long-pass filter).
(a, b) Prior to introduction of the PSiNPs, substantial tissue autofluorescence from endogenous fluorophores in the liver is observed in the CWI (a), while this short-lived autofluorescence is eliminated in the TGI (b). Two types of PSiNPs were then locally injected in different regions of the same liver (indicated with the dotted line in d–f). Sample designated as PSiNP-1: as-prepared, injected dose: 30 μg/mL, 5 μL; Sample PSiNP-2: nanoparticle preparation similar to PSiNP-1 but aged in PBS at 37°C for 4 h prior to injection, injected dose: 120 μg/mL, 10 μL. (c) Time-resolved PL emission intensity decays for the two injected PSiNP samples and for the native liver tissue. Data were acquired from the region of interest (ROI) as indicated in (e). The excitation source is turned off at time = 0, and so the traces prior to time = 0 represent emission intensity under continuous excitation. Both PSiNP samples display long-lived luminescence, while the liver displays a very rapid decrease characteristic of tissue autofluorescence. (d) CWI and (e, f) TG images of the PL emission, extracted from the different acquisition time periods as indicated in the color panels of (c).

