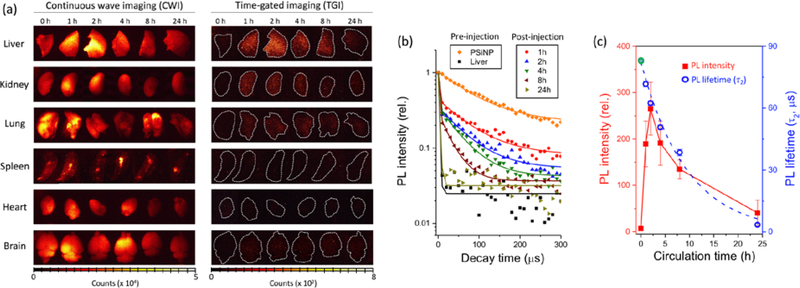
Figure 4. Tracking the fate of PSiNPs in vivo based on their PL characteristics.
(a) Representative CWI and TGI of mouse organs harvested after in vivo injection and circulation of PSiNPs for the indicated times (𝜆ex = 365 nm, 𝜆em = 460 nm long-pass filter). Note that tissue autofluorescence is removed in the TGI, enabling clear identification of the PSiNPs. Dotted white lines are drawn to outline the organs in the TGI. The “0 h” images indicate a control set, obtained from a mouse that was not injected with PSiNPs. (b) Normalized PL decay curves obtained from livers harvested from treated mice. The times indicated represent hours post-injection. Trace labeled “PSiNP” represents the PSiNP dispersion in PBS prior to injection. Trace labeled “Liver” represents the liver of a healthy mouse that was not injected with PSiNPs. The long-lived component of the PL emission lifetime, τ2, represents the PL emission lifetime that can be definitively assigned to PSiNPs. (c) Plots of total PL intensity from the liver, obtained from the TGI images in (a), and emission decay lifetime (τ2) as a function of in vivo circulation time. Each data point represents mean ± standard deviation (n = 3). Note that the PL lifetime at 0 h (green open circle) was obtained from the decay curve of the PSiNPs in PBS solution (orange diamonds in (b)), fit to a single exponential function.

