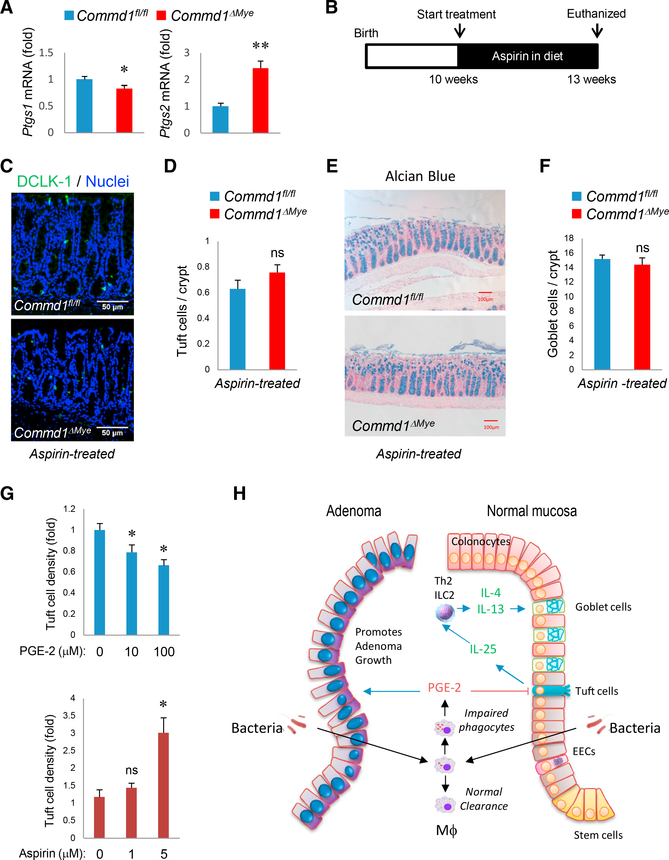
Figure 7. Prostaglandins Affect Tuft Cell Density and Epithelial Differentiation.
(A) Real-time qPCR analysis for the indicated genes in colonic tissue of Commd1fl/fl (n = 3) or Commd1ΔMye mice (n = 4). Data are the aggregate of 2 experiments and indicate the mean and SEM. *p < 0.05; **p < 0.01 (unpaired Student’s t test).
(B) Schematic depicting the aspirin treatment course for data shown in (B), (C), (D), and (E).
(C) Representative images (from over 5 independent iterations) of immunofluorescence staining for DCLK-1 (green) and nuclei (Hoechst, blue) in colonic tissues of Commd1fl/fl or Commd1ΔMye mice treated with aspirin. Scale bars, 50 μm.
(D) Quantification of images shown in (C) for Commd1fl/fl or Commd1ΔMye mice (5 and 4 animals, respectively) that had been treated with aspirin. Quantitative data indicate mean and SEM. ns, not significant (unpaired Student’s t test).
(E) Representative images of Alcian blue staining of colonic tissues from Commd1fl/fl or Commd1ΔMye mice treated with aspirin. Scale bars, 100 μm.
(F) Quantification of goblet cell density from images shown in (E) for Commd1fl/fl or Commd1DMye mice (5 and 4 animals, respectively) that had been treated with aspirin. Quantitative data indicate mean and SEM. ns, not significant (unpaired Student’s t test).
(G) Quantification of Tuft cell density in colonic2D organoids supplemented with PGE-2 (top) or aspirin (bottom) in the growth media. Data displayed indicate mean and SEM (representative of 2 experiments with four technical replicates). *p < 0.05; ns, not significant (unpaired Student’s t test).
(H) Model highlighting how bacterial penetration in the mucosa can affect adenoma formation and epithelial differentiation. Stimulatory signals are indicated by blue arrows; inhibitory signals are noted by red arrows.

