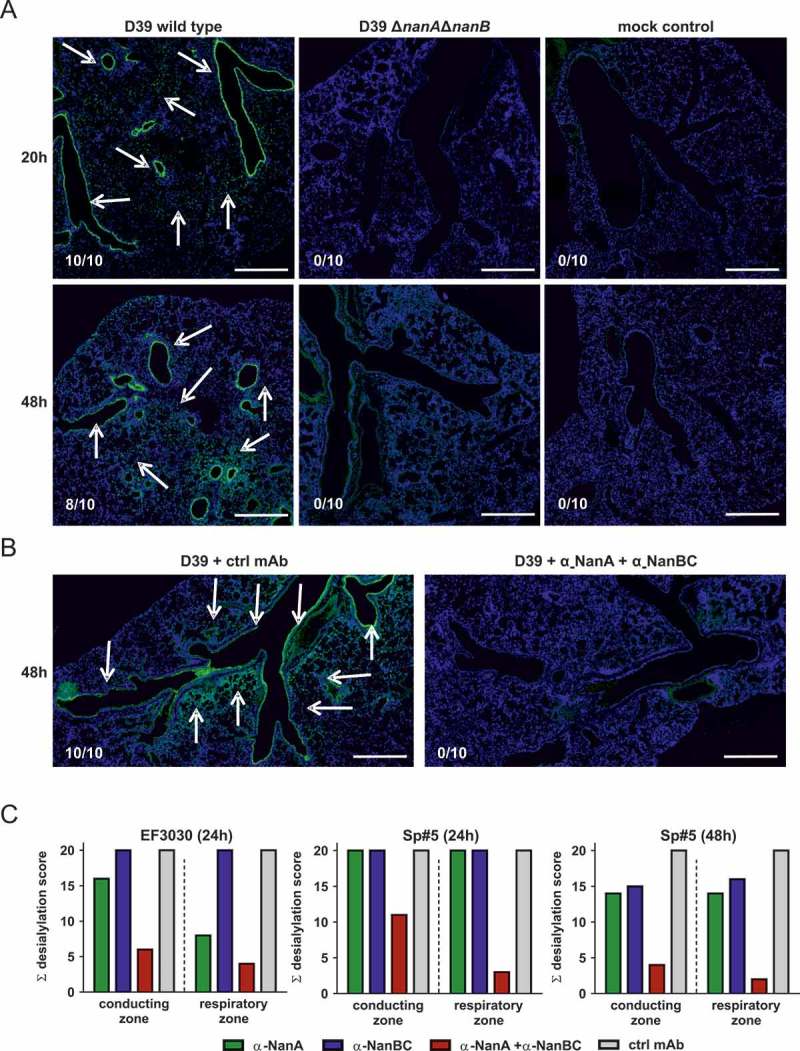
Figure 6.

Neuraminidases of different S. pneumoniae isolates desialylate murine lungs in vivo. Mice infected intranasally with S. pneumoniae D39, or D39ΔnanAΔnanB (A), or S. pneumoniae D39 + both α-neuraminidase mAbs (B), or S. pneumoniae EF3030 or Sp#5 in the presence of individual α-neuraminidase mAbs (c) for the indicated times. Arrows indicate desialylation as visualized by Lectin-FITC staining (green). Low levels of apparent signal for the Lectin-FITC staining were non-specific and also seen in uninfected controls. Nuclei were stained with Hoechst dye (blue). Representative lung images of each treatment group are shown. Numbers indicate the observed frequencies of desialylation. Scale bar = 500 μm. (C) Semi-quantitative scoring of conducting and respiratory zone desialylation by EF3030 and Sp#5 in presence of α-neuraminidase mAbs.
