
Figure 2.
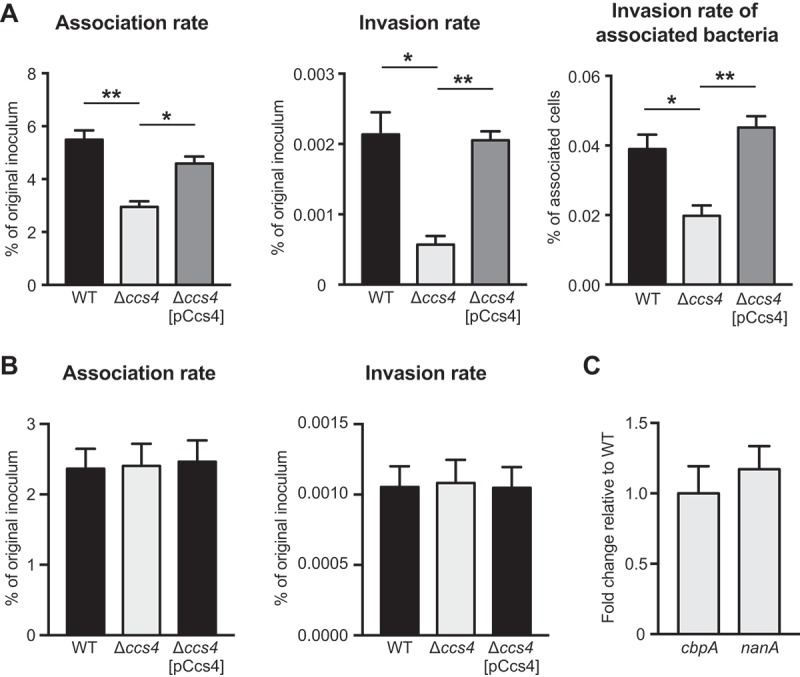
Pneumococcal interaction with hBMECs and A549 cells. (a) Rates of association with and invasion into hBMECs by S. pneumoniae TIGR4 WT, Δccs4, and Δccs4[pCcs4] strains. (b) Rates of association with and invasion into A549 cells by S. pneumoniae WT, Δccs4, and Δccs4[pCcs4] strains. Association rates were calculated by dividing the CFU value obtained at 1 hour after infection by the value for the original inoculum. Invasion rates were calculated by dividing the CFU value obtained at 1 hour after antibiotic addition by the value for the original inoculum. Values are presented as the mean of 6 wells from one of 3 independent experiments. Vertical lines represent the mean + S.E. Statistical differences between groups were analyzed using a Kruskal-Wallis test with Dunn’s post hoc test. (c) Expression levels of nanA and cbpA. The nanA and cbpA gene expression levels in the Δccs4 strain were examined by qPCR, and shown relative to that of the WT strain. 16S rRNA was used as the internal control. Data are presented as the mean of 3 representative samples from the representative of 3 independent experiments. Vertical lines represent the mean + S.E. *p < 0.05 and **p < 0.01.