. 2018 Sep 21;7:e35316. doi: 10.7554/eLife.35316

Figure 3. Acute hypoxia increases 4-HNE accumulation and increases TRPA1 sparklet frequency in the cerebral endothelium.

(A) Representative maximum intensity projection of Z-stacks of cerebral arteries mounted en face and exposed to PSS equilibrated with a normoxic (21% O2, 6% CO2, 73% N2, left panel) or hypoxic gas mixture (5% O2, 6% CO2, 89% N2, right panel) and immunolabeled for 4-HNE (red). Scale bar = 40 µm, nuclei of cells are labeled by DAPI (blue). Acute hypoxia significantly increased 4-HNE immunoreactivity in cerebral arteries (*p<0.05 Student’s t-test, N = 10–9 fields of view from three different experiments). (B) Representative pseudocolored images of cerebral arteries from Tek:Gcamp6f mice mounted en face and exposed to normoxic (left panel) or hypoxic (middle and right panels) PSS in the presence or absence of the selective TRPA1 blocker A967079 (1 µM). Green: active TRPA1 sparklet sites. Scale bar = 20 µm. (C) Representative ΔF/F0 vs. time plots for a single sparklet site showing an increase in TRPA1 sparklet frequency during hypoxia which was significantly inhibited by the TRPA1 blocker A967079. (D) Summary data showing the effects of hypoxia on TRPA1 sparklet frequency (left), site frequency (middle) and number of sites per cell (right) in the presence and absence of the selective TRPA1 inhibitor A967079 (1 µM). (*p<0.05, one-way ANOVA; N = 25–28 – 33 fields of view from six different arteries isolated from six mice). TRPA1 sparklets were recorded in the presence EGTA-AM (10 µM) and CPA (30 µM).

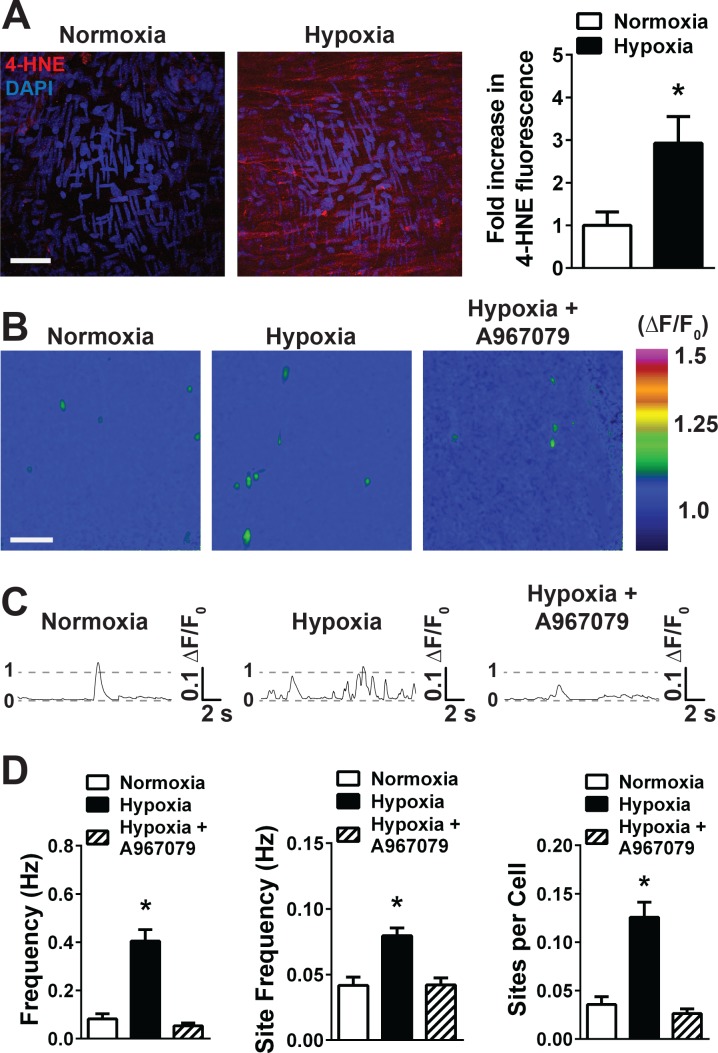
Figure 3—source data 1. Excel spreadsheet containing the individual numeric values of the parameters analyzed in Figure 3.
DOI: 10.7554/eLife.35316.027

Figure 3.

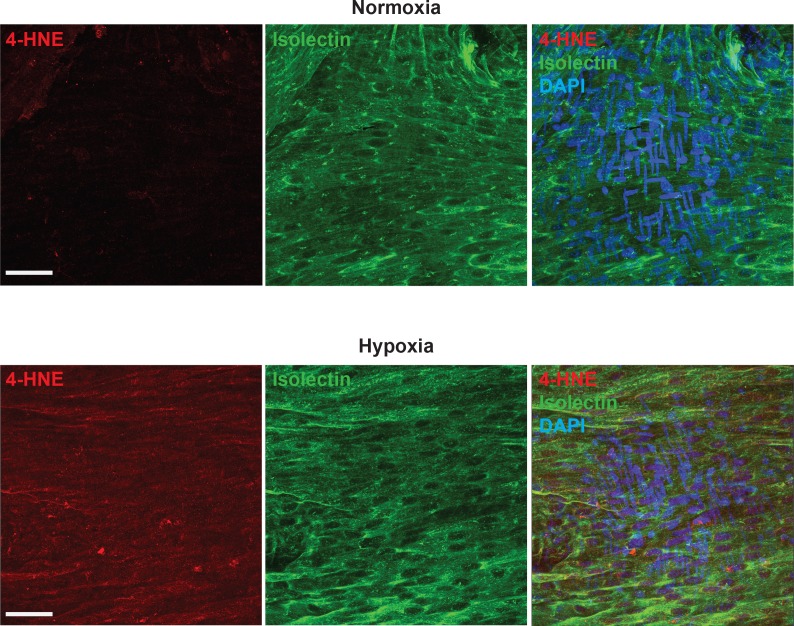
Figure 3—figure supplement 1. Hypoxia causes 4-HNE accumulation in cerebral arteries.

Figure 3—figure supplement 1.

Representative maximum intensity projection images of en face cerebral arteries immunolabeled for 4-HNE (red) and stained with isolectin conjugated to AlexaFluor 488 (green) after superfused with normoxic (top images) or hypoxic (bottom panels) physiological saline solution (PSS). The panels on the right are overlay images showing nuclei staining (DAPI, blue). Images are representative of 3 different experiments from 10 basilar arteries. Scale bar = 40 μm.
Figure 3—figure supplement 1—source data 1. Excel spreadsheet containing the individual numeric values of the parameters analyzed in Figure 3—figure supplement 1.
DOI: 10.7554/eLife.35316.024
Figure 3—figure supplement 2. Properties of hypoxia-induced TRPA1 sparklets.

Figure 3—figure supplement 2.

Frequency distribution plots of hypoxia-induced TRPA1 sparklet in en face cerebral arteries from Tek:Gcamp6f mice. Recorded events showed a mode peak amplitude of 1.10 ΔF/F0, a mode duration of 240 ms and a mode spatial spread of 12 µm2. A total of 437 events were plotted to analyze frequency distribution. TRPA1 sparklets were recorded in the presence of EGTA-AM (10 µM) and CPA (30 µM).
Figure 3—figure supplement 2—source data 1. Excel spreadsheet containing the individual numeric values of the parameters analyzed in Figure 3—figure supplement 2.
DOI: 10.7554/eLife.35316.026