. 2018 Oct 9;7:e35685. doi: 10.7554/eLife.35685

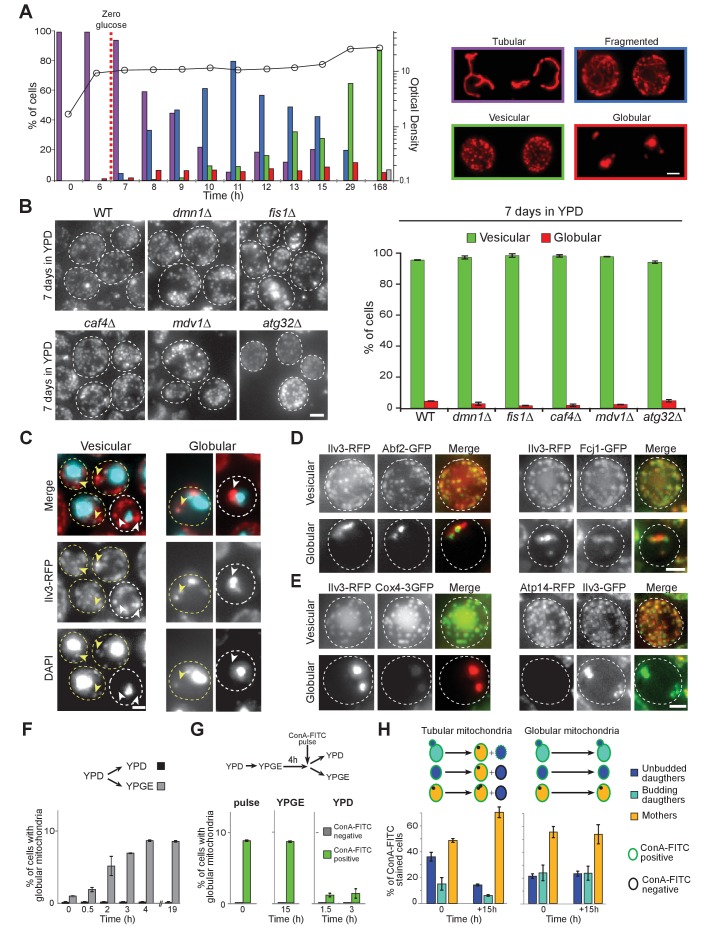
Figure 1. Mitochondrial network reorganization in non-proliferating cells.

(A) Mitochondrial network organization in WT cells expressing Ilv3-RFP as a function of time in YPD (OD600nm: circles). Cells with a tubular (violet), a fragmented (blue), a vesicular (green), a globular (red) mitochondrial network or no Ilv3-RFP signal (grey) were scored. Representative cells of each category are shown; n > 500, N = 2. (B) WT, dnm1Δ, fis1Δ, caf4Δ, mdv1Δ, and atg32Δ cells expressing Ilv3-RFP were grown 7 d in YPD. Histograms display the percentage of Ilv3-RFP positive cells with a vesicular (green) or a globular (red) mitochondrial network; n > 200, N = 2. (C) WT cells expressing Ilv3-RFP were grown 7 d in YPD and stained with DAPI. Yellow and white arrows point to stained or unstained mitochondria respectively. (D) WT cells grown 7 d in YPD co-expressing Ilv3-RFP and the mitochondrial DNA-binding protein Abf2-GFP or the MICOS complex protein Fcj1-GFP. (E) WT cells grown 7 d in YPD co-expressing Ilv3-RFP and the respiratory chain component Cox4-GFP or co-expressing Ilv3-GFP and the ATP synthase subunit Atp14-RFP. (F) WT cells expressing Ilv3-RFP were grown in YPD to OD600nm ~ 1. Cells were then shifted to YPD (black) or YPGE (grey). Cells with globular mitochondria were scored; n > 300, N = 2. (G) WT cells expressing Ilv3-RFP were grown in YPD to OD600nm ~ 1. Cells were then shifted to YPGE. After 4 hr, cells were pulse stained with ConA-FITC and shifted to YPD or YPGE. The percentage of cells with globular mitochondria was scored within both ConA-FITC stained (green) and unstained (grey) cell populations; n > 250, N = 2. (H) Cells from (G) were stained with calcofluor white concomitantly to the ConA-FITC pulse or 15 hr after the transfer to YPGE. The percentage of ConA-FITC positive mother (orange), unbudded daughter (dark blue) and budding daughter (light blue) cells were scored; n > 250, N = 2. Histograms show means, error bars are SD, bar is 2 μm.

Figure 1—source data 1. Cell category scoring for each replicated experiment in Figure 1 panel A, B and F to H.
DOI: 10.7554/eLife.35685.005

Figure 1.

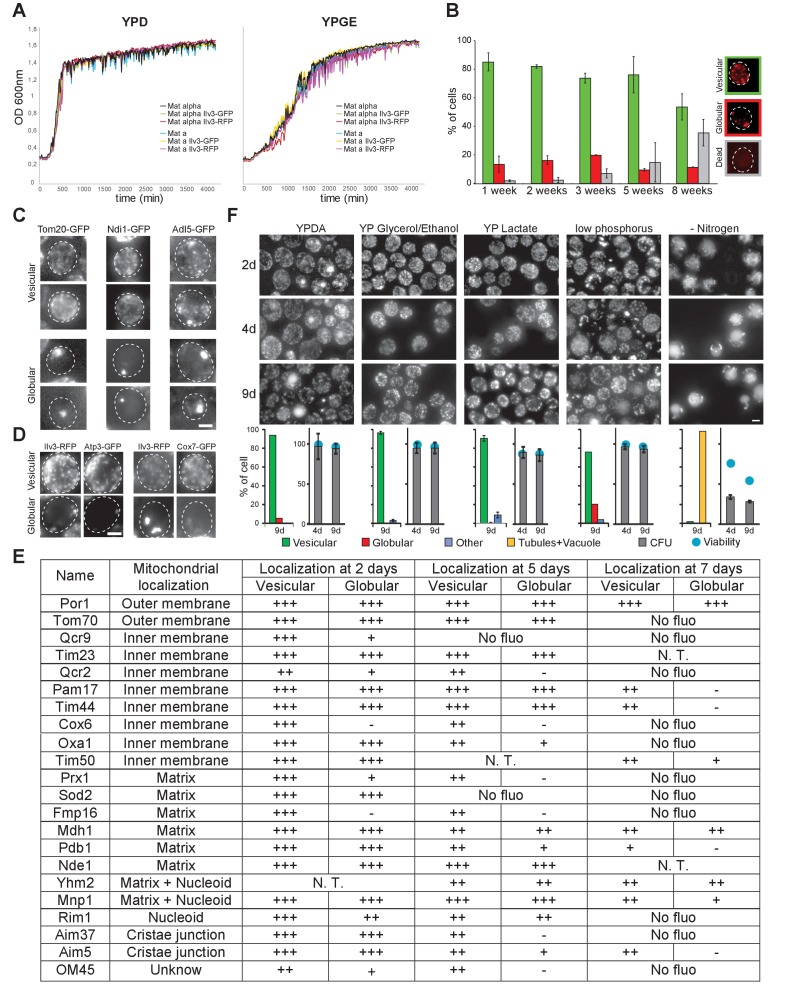
Figure 1—figure supplement 1. Mitochondrial network organization in WT cells experiencing an extended period of non-proliferation or upon starvation for various nutrients and localization of various mitochondrial proteins in non-proliferating cells.

Figure 1—figure supplement 1.

(A) Proliferation in YPD or YPGE of WT cells of the indicated genotype monitored by measuring OD600nm as a function of time. (B) Mitochondrial network organization of WT cells expressing Ilv3-RFP experiencing an extended period of non-proliferation. Cells with a vesicular (green), a globular (red) or no Ilv3-RFP signal (grey) were scored (n > 300, N = 2). (C) Tom20-GFP, Ndi1-GFP and Adl5-GFP localization in WT cells grown for 4 d in YPD. (D) Sdh2-GFP or Atp4-GFP localization in WT cell expressing Ilv3-RFP grown for 7 d in YPD. (E) Localization of various mitochondrial proteins fused to GFP (endogenous locus) and expressed in WT cells grown for the indicated time in YPD. (+) indicates that the protein is detected within the mitochondria of each cell category, (-) indicates that no fluorescence was detected in a specific cell category, (no fluo) means that no fluorescence was detected whatever the cell category, (N.T.) means not tested. (F) Mitochondrial network organization in WT cells expressing Ilv3-RFP grown in the indicated medium and imaged after 2, 4, 9 days. Graphs present the mitochondria organization at 9 days (left, n > 200, N = 2), cell viability and cell capacity to form a colony (right, viability: n > 200, N = 2; CFU: n = 750, N = 9). Of note, more than 95% of the cells grown 7 days in YPGE were individually able to re-enter proliferation after re-feeding on microscope pad.
Figure 1—figure supplement 1—source data 1. Cell category scoring for each replicated experiment in Figure 1—figure supplement 1 panel A, B and F.
DOI: 10.7554/eLife.35685.004