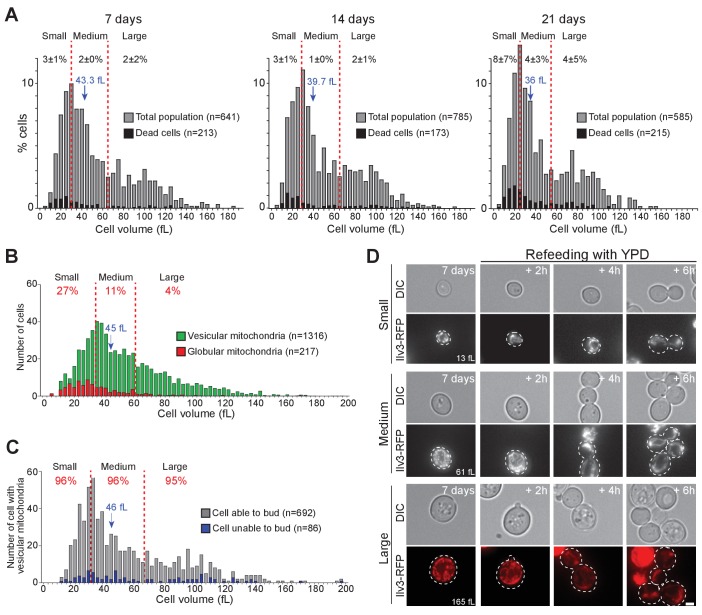
Figure 3. Cell volume and individual cell fate.
(A) Cell volume distribution of WT cells grown for 7, 14, and 21 d in YPD. In A to C, red dashed lines define three sub-populations each representing 1/3rd of the total population. Dead cells (black bars) were identified using methylene blue staining (N = 3). Black numbers indicate the percentage of dead cells within each cell sub-population. (B) Cell volume distribution according to the mitochondrial organization (vesicular: green, globular: red, N = 3) of 7-d-old WT cells expressing Ilv3-RFP. Red numbers indicate the percentage of cells with globular mitochondria within each cell sub-population. (C) Cell volume distribution of 7-d-old WT cells expressing Ilv3-RFP with vesicular mitochondria according to cell re-proliferation capacity. Red numbers indicate the percentage of cells able to bud within 6 hr after refeeding onto a YPD microscope pad within each sub-population (for small cells, n = 235, medium cells n = 226 and large cells n = 231). In A to C, the population median cell volume is indicated in blue. (D) Image series of individual small, regular and large cells with vesicular mitochondria upon refeeding on a YPD microscope pad. Cell volumes before re-feeding are indicated. Bar is 2 μm.


