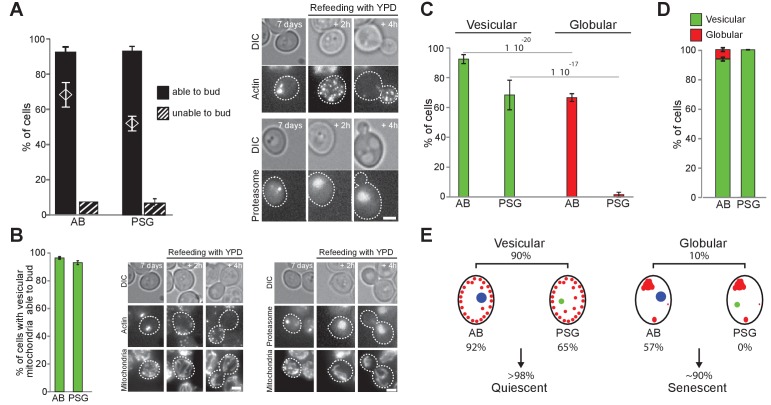
Figure 5. Actin, proteasome and mitochondrial network reorganization.
WT cells expressing Ilv3-RFP and Abp1-3xGFP (actin) or Scl1-GFP (proteasome) were grown 7 d in YPD and refed on a YPD microscope pad. (A) Histograms show the percentage of individual cells displaying AB or PSG able to form a bud within 6 hr after re-feeding. The theoretical ‘independence’ value (diamond) and representative image series are shown; n > 200, N = 2. (B) Percentage of individual cells able to form a bud among cells with both a vesicular mitochondrial network and AB or PSG. Representative image series are shown; n > 300, N = 2. (C) Actin and proteasome organization in cells within vesicular and globular mitochondria cell populations; n > 300 N = 2. (D) Mitochondria organization in cells with AB or PSG; n > 450 and>300 respectively, N = 2. Bars are 2 μm. (E) Cell type and fate distribution among a WT population grown for 7 d. Vesicular mitochondria (small red dots), globular mitochondria (big red dots), AB (big blue dot) and PSG (green dot) are schematized.
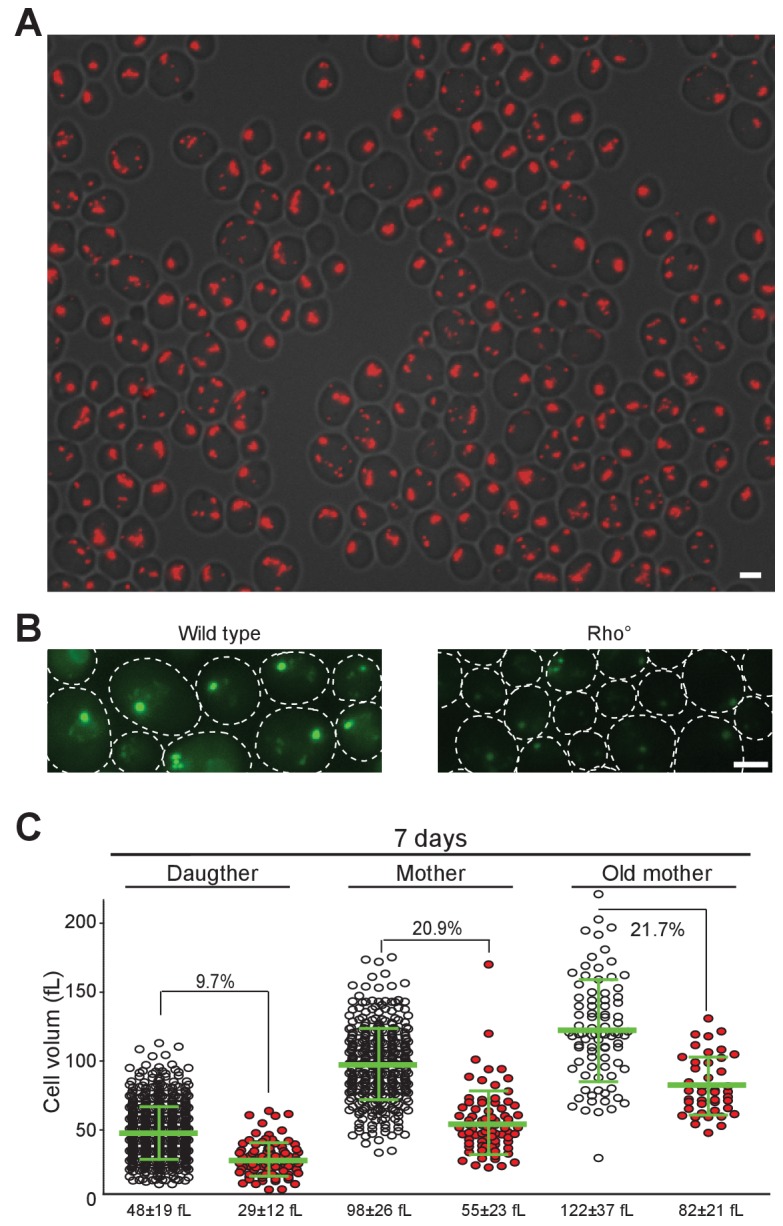
Figure 5—figure supplement 1. Actin and Proteasome localization in WT and rho zero cells, cell volume variation according to mitochondrial network organization.


