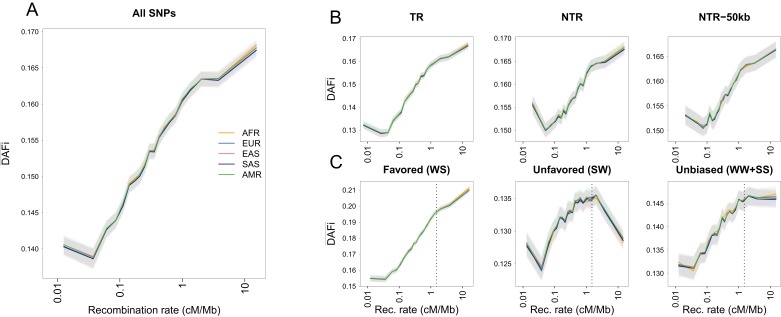
Figure 1. Average derived allele frequency per individual () as a function of recombination rate.
1000G SNPs were ranked by their local recombination rate and divided into 20 bins of equal size. was computed for each individual as the number of heterozygous sites plus two times the number of derived homozygous sites and averaged per geographic region. (A) vs. recombination rate on a log10 scale for all 17,129,351 1000G SNPs. (B) Same as panel A for SNPs in transcribed regions (TR), non-transcribed regions (NTR), or non-transcribed regions more than 50 kb away from TR (NTR-50kb). (C) Same as panel A for SNPs differently affected by GC-biased gene conversion (gBGC). Left: WS sites, where the derived allele is favored by gBGC. Center: SW sites, where the ancestral allele is favored by gBGC. Right: WW and SS sites, which are not affected by gBGC. The vertical dashed lines at 1.5 cM/Mb delimit an approximate threshold above which BGS has no effect on WW and SS sites, but where gBGC has a strong and opposite effect on WS and SW sites. Each group (AFR: Africans, EUR: Europeans, EAS: East-Asians, SAS: South Asians, AMR: Admixed Americans) includes individuals from two populations (see Supplementary file 1 - Table S1). Shaded areas delimit the 95% confidence interval of each group, estimated using a block-bootstrap approach (see Materials and methods).

