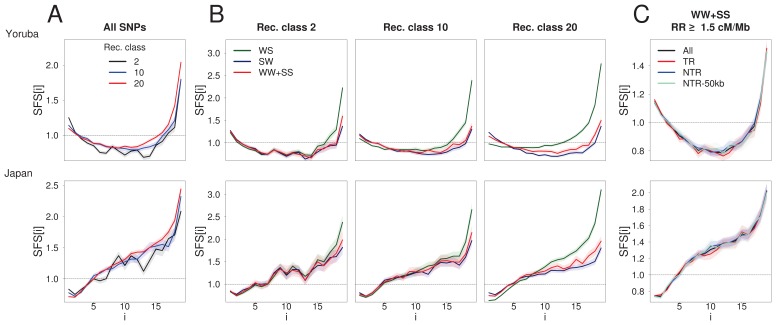
Figure 2. BGS and gBGC both have an impact on the SFS.
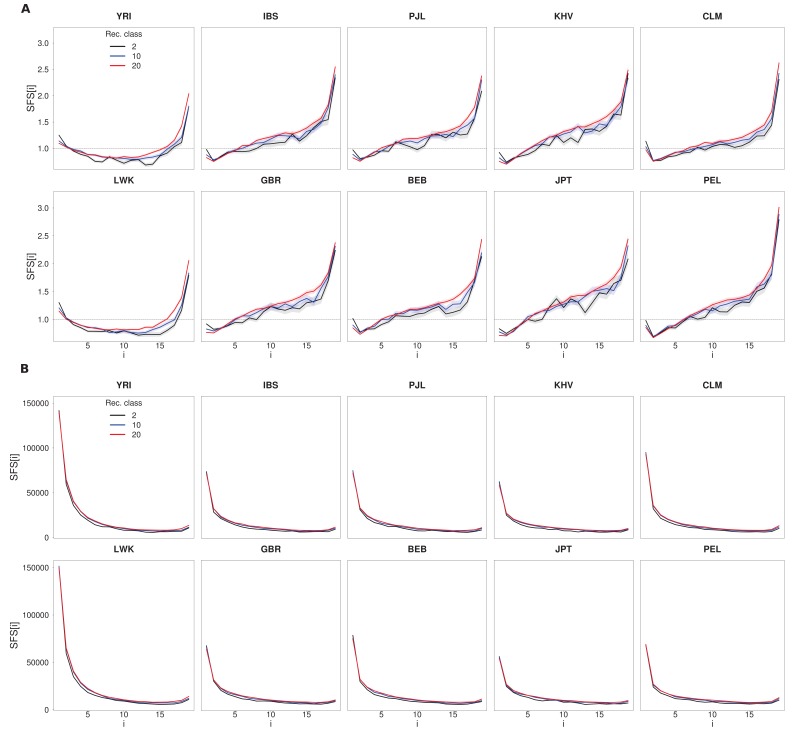
Each panel corresponds to the normalized unfolded SFS of Yoruba (top, YRI) and Japanese (bottom, JPT) populations. (A) SFS computed for all SNPs in the 2nd, 10th and 20th recombination classes (as defined in Figure 1). For each panel, pairwise comparisons of the SFS are significant with p-values<10–3 (see Materials and methods). The SFS for all ten 1000G populations are shown in Figure 2—figure supplement 1. (B) SFS for three gBGC mutation categories computed for three recombination classes. Note that WW and SS sites (in red) are unaffected by gBGC. All SFS are different from each other (site permutation test, p-values<10–3) except for the Yoruba recombination class two between WS and WWSS where p=0.0135. (C) SFS for sites unaffected by BGS and gBGC (WW + SS sites with RR ≥1.5 cM/Mb). The four SFSs are not significantly different from each other at the 1% significance level, as revealed by a permutation approach (see Materials and methods). Shaded areas delimit 95% confidence intervals using a block-bootstrap strategy (see Materials and methods).


