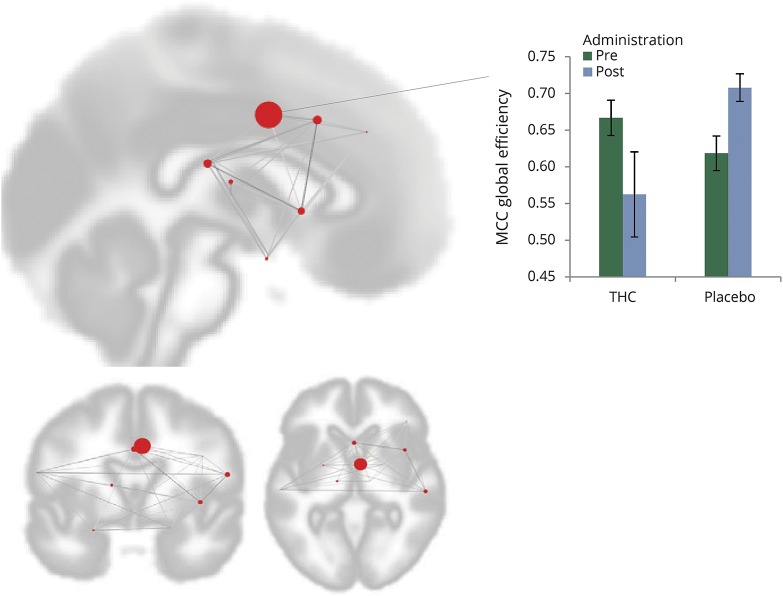
Figure 5. Global efficiency change in middle cingulate cortex (MCC) after δ-9-tetrahydrocannabinol (THC)/placebo administration.
MCC global efficiency changed significantly after THC administration (interaction effect F1,14 = 3.05; p-FDR = 0.0477). Each red circle represents a cluster within the network and its size represents the effect change. The bar graph demonstrates the interaction effect of THC and placebo. Error bars represent SEM.

