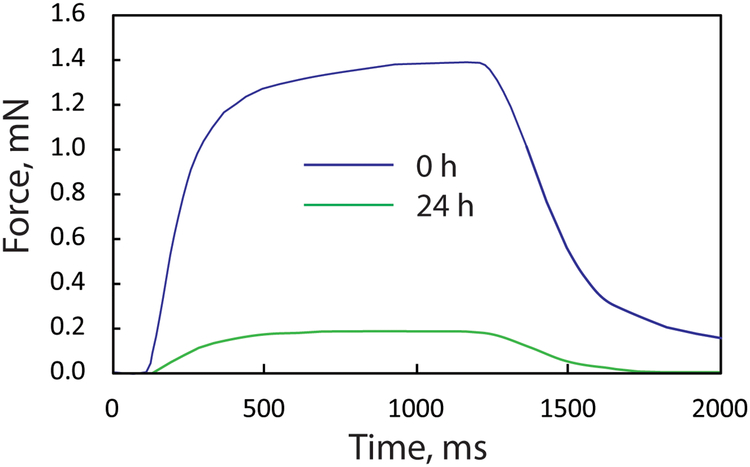
Figure 6.
Effect of 24 h exposure to 10 μM terfenadine on the tetanus force of myobundles in the arrangement show in Figure 1A. The blue curve represents the myobundle force occurring during a 0.8 s electrical stimulation at 20 Hz at the time of application of terfenadine and the green curve represents the tetanus force after 24 h exposure to 10 μM terfenadine. Exposure to the DMSO vehicle in which terfenadine was dissolved did not affect the tetanus force (unpublished results).

