
Figure 4.
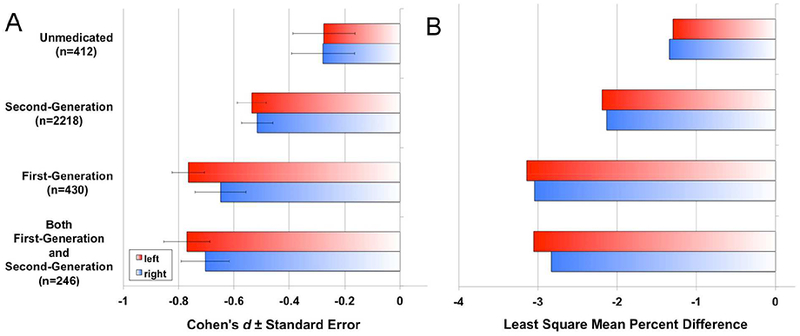
A) Cohen’s d effect sizes, and B) least square mean percent difference for schizophrenia versus healthy group contrasts in global cortical thickness, statistically controlling for age, and sex, by medication group and hemisphere. Nominal one-tailed p-values for left (L) and right (R) hemisphere thickness group comparisons, statistically controlling for age and sex, were: Second-Generation vs. Unmedicated [p(L)<0.05; p(R)<0.06]; First-Generation vs. Unmedicated [p(L)<0.01; p(R)<0.002]; Both First-Generation and Second-Generation vs. Unmedicated [p(L)<0.02; p<0.05]; First-Generation vs. Second-Generation [p(L)<0.03; p(R)<0.03]; Both First-Generation and Second-Generation vs. Second-Generation [p(L)<0.02; p(R)<0.05]; Both First-Generation and Second-Generation vs. First-Generation [p(L)=0.50; p(R)=0.48]; Supplementary Tables S16–S21).