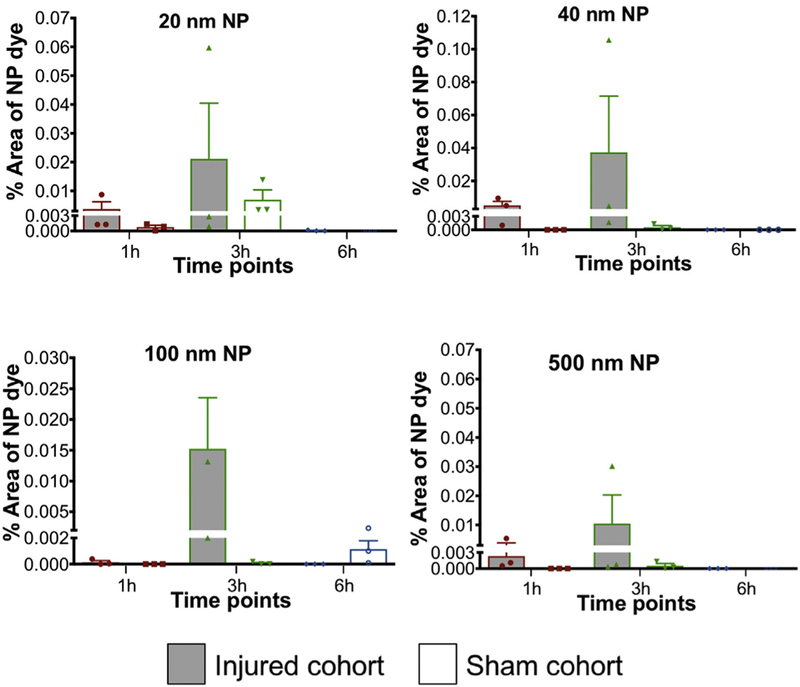
Figure 6.

Nanoparticle accumulation after midline-FPI in corpus callosum. Accumulation of (a) 20 nm, (b) 40 nm, (c) 100 nm and (d) 500 nm nanoparticles at different time points (1 h, 3 h, and 6 h) after FPI. NPs were injected 1 h before sacrifice. Two-way ANOVA statistical test was conducted. Two-segmented y-axis is used to display the sham groups. Error bars represents standard error of mean with n = 3 animals per group.Correlation of HRP and NP accumulation after midline-FPI.
