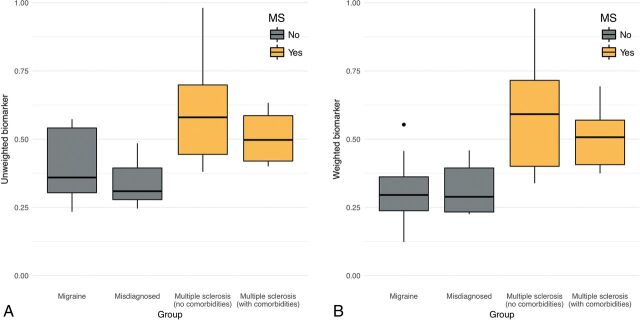
Fig 2.
Boxplots of the patient-level central vein sign biomarker score by diagnostic group. The score can be interpreted as the proportion of lesions that are CVS+ according to the method described in this article. Groups shaded gray do not have an MS diagnosis, whereas groups shaded gold do. A, Boxplots for the unweighted biomarker. B, Boxplots for the noise-weighted biomarker. Points outside the boxplots represent outliers within their respective groups.

