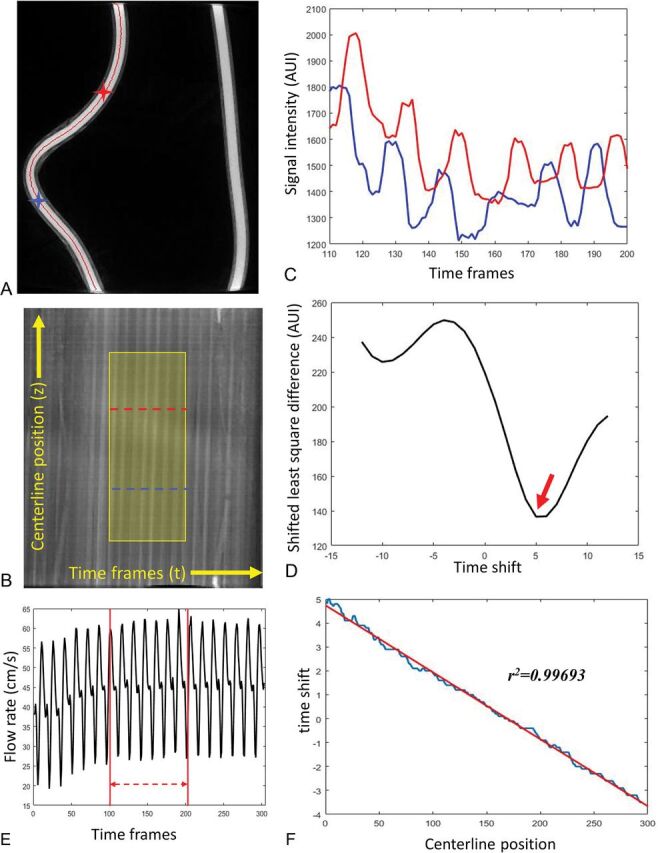
Fig 1.

A representative phantom study demonstrates the flow calculation from 4D-DSA. A, MIP image of the reconstructed phantom with centerline (red) overlaid. B, The contrast waveform map of the voxels along the centerline. The horizontal direction is the timeframe in the 4D-DSA scan, and the vertical direction is the position along the vessel centerline. Each point in the map M(t,z) represents the signal intensity of the voxel at distance z along the centerline and at time frame t. The highlighted area is the optimized waveform region where the pulsatility is strong and consistent. TCCs of 2 selected voxels along the centerline (marked as blue and red stars on A and blue and red curves on B) are shown in C. D, The least-squares differences of these 2 signals as a function of the time-shift, in which the minimal appears at τ0 = 5 shown as red arrow on D is considered as the time of bolus transport from the blue voxel to the red voxel. The time-shift as a function of the centerline position was fit to a linear relation (F), where the slope is the inverse of the velocity. E, The flow profile recorded from the flow probe (downsampled to 1/30 second to correspond to the 4D-DSA timeframes). Flow measurement is the average taken between the red lines, which correspond to the optimized window shown in B. AUI indicates arbitrary unit of intensity.
