
Figure 1: Pedigree structures and mutation rates in owl monkeys.
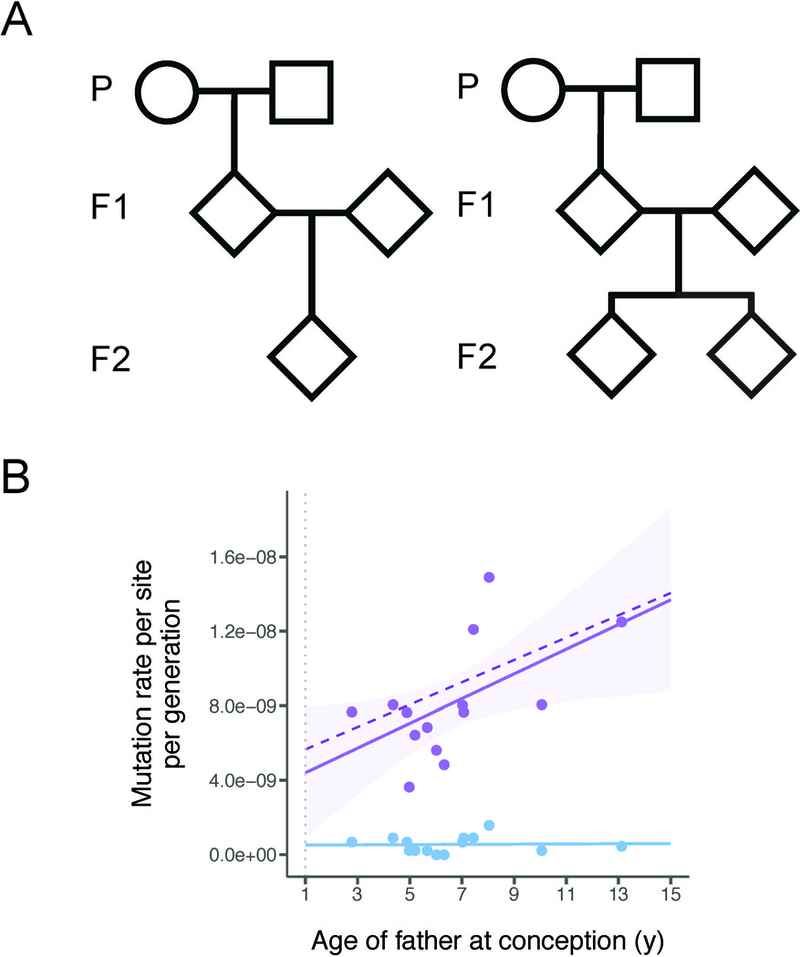
A, We used six multi-generation pedigrees in these two formats. Four families have a single F2 offspring (left) while two families have two F2 offspring (right). In total, 14 independent trios can be constructed from these pedigrees. B, Mutation rate estimates from the 14 owl monkey trios (purple points). A simple linear regression has been fit to these points (solid purple line) to show that the number of mutations increases with the father’s age. Our model of reproductive longevity (dashed purple line) is not significantly different from the fit of the linear regression. The rate of non-replicative mutations, such as those that occur at CpG sites (blue dots), are not correlated with reproductive longevity (blue line). The dotted vertical grey line indicates expected age of puberty. See also Data S1, Figure S1.