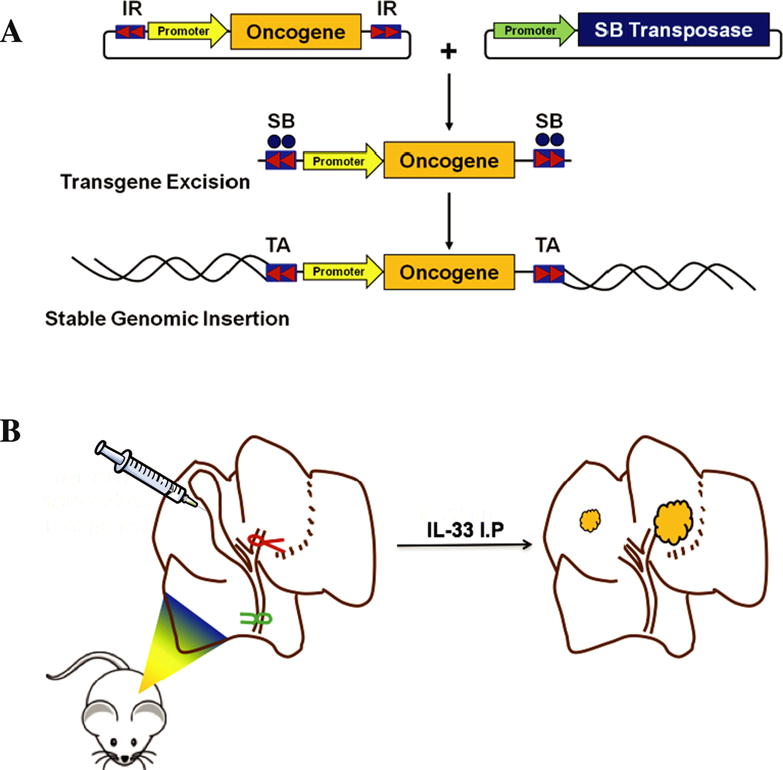
Figure 3. AKT/YAP BDL model.

(A) Schematic diagram depicting a transposon-transposase transduction system. The transposon carrying the oncogene is cotransfected with the transposase. When transduced into the same cell, the transposase excises the target oncogene, allowing its incorporation into the host cells genome. (B) Schematic diagram depicting the surgical approach utilized in the AKT-YAP biliary transduction model [89].
