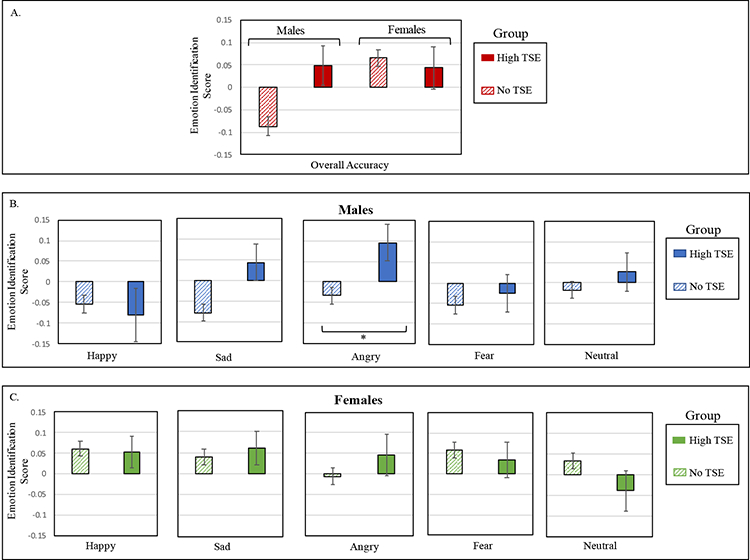
Figure 2. Accuracy performance on Emotion Intensity Differentiation task, by Exposure Group.

Panel A. Means and standard errors for accuracy on the Emotion Intensity Differentiation task, plotted by Sex and Exposure Group. Performance on each of the separate emotions are displayed for males (panel B) and females (panel C). In all analyses, age and race/socioeconomic Z-score were regressed out. TSE=Traumatic Stressful Events. *p ≤ .01.
