
Figure 1.
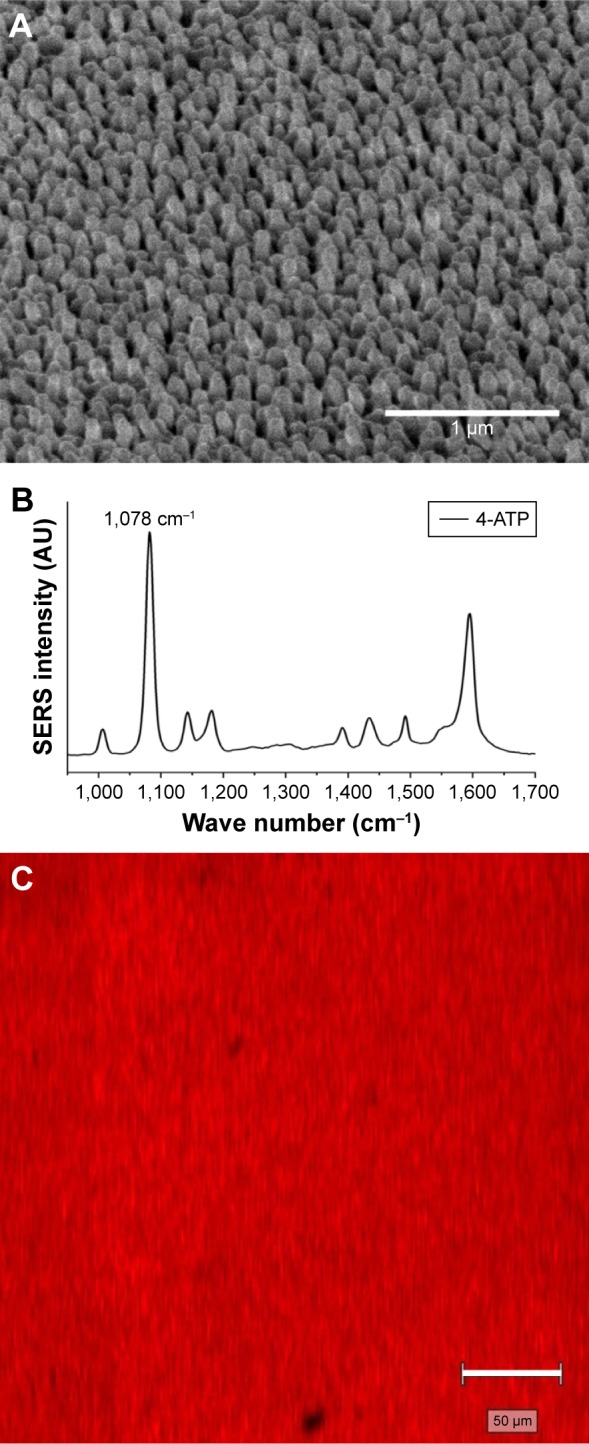
(A) FE-SEM of Ag-SNP SERS substrate. Scale bar 1 µm. (B) Representative SERS spectra of 4-ATP molecule with a prominent peak at 1,078 cm−1. (C) SERS mapping shows the minimum variation in SERS enhancement for 4-ATP on the Ag SNP substrate. Scale bar 50 µm.
Abbreviations: ATP, aminothiophenol; FE-SEM, field-emission scanning electron microscopy; SERS, surface-enhanced Raman scattering; SNP, silicon nanopillar.