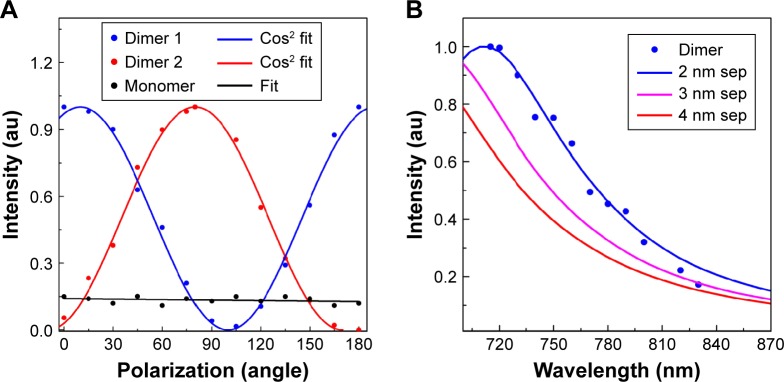
Figure 5.
(A) Intensity variation due to polarization (0°–180°) dependency. Experimental values for dimer P1 and P2 (shown in Figure 4 as the dotted points) extracted from polarization dependent images for 0°–180°, matched perfectly with cosine fitting. (B) Wavelength dependency images for dimer particle P1 matched perfectly with finite-difference time-domain simulated dimer spectrum for 2 nm separations.
Abbreviation: P, particle.

