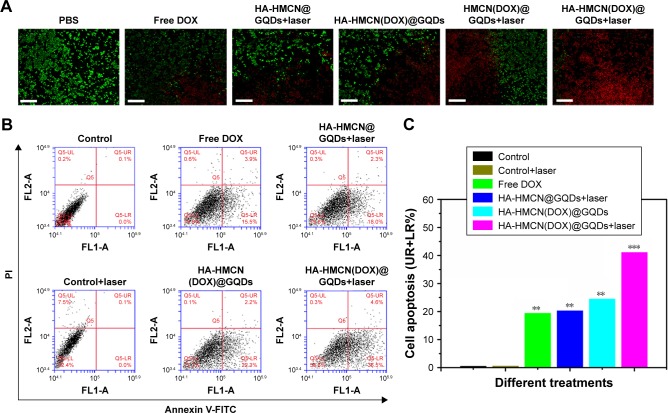
Figure 6.
In vitro antitumor activity and cell apoptosis analysis.
Notes: (A) Fluorescence images of HeLa cells co-stained with calcein AM (live cells, green) and PI (dead cells, red) after different treatments: control, free DOX, HA-HMCN(DOX)@GQDs, HA-HMCN@GQDs+laser, HMCN(DOX)@GQDs+laser, and HA-HMCN(DOX)@GQDs+laser. Scale bars: 100 µm. (B) Flow cytometric analysis of HeLa cells’ apoptosis for 12 hours induced by different treatments, performed using Annexin V-FITC/PI staining and (C) the corresponding cell apoptosis analysis. ** and *** respectively indicate P<0.01 and P<0.001 vs control.
Abbreviations: DOX, doxorubicin; FITC, fluorescein isothiocynate; GQDs, graphene quantum dots; HA, hyaluronic acid; HMCN, hollow mesoporous carbon nanoparticle; PI, propidium iodide.

