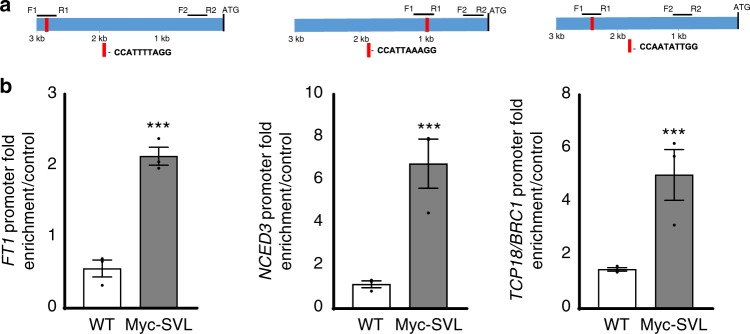
Fig. 4.
SVL binds to FT1, NCED3, and TCP promoters in vivo in chromatin immunoprecipitation (ChIP) assays. a Diagrammatic representation of FT1, NCED3, and TCP18/BRC1 promoters showing the CArG motif and their positions within a 3 kb region. F1–R1 indicates positions of DNA fragments used to assess DNA–protein interactions in ChIP assays, and F2–R2 indicates positions of DNA fragments with no CArG motif used as negative controls in the assays. b Enrichment of the DNA fragments containing the CArG motif quantified by ChIP-q-PCR. Presented values were first normalized by their respective input values, then fold enrichments in WT and Myc-SVL plants relative to negative controls were calculated. Bars show an average values from three independent biological replicates ± SEM. Asterisks indicate significant (*P < 0.05), very significant (**P < 0.005) and extremely significant (***P < 0.001) differences from corresponding controls, respectively. Statistical analysis was done using t-test

