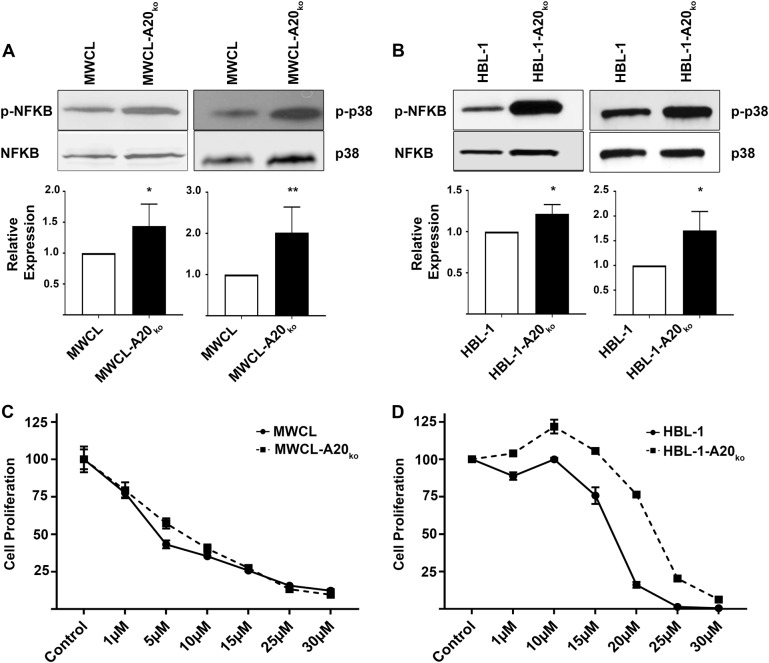
Fig. 2. Increased baseline NF-κB and p38 phosphorylation in MWCL-A20ko and HBL-1-A20ko cells impacts ibrutinib response.
a Western blot analysis of phosphorylated NF-κB in MWCL (n = 4) and HBL-1 (n = 3) A20 knock out cell lines and their wild type counterpart. Total NF-κB was used as a loading control. b Western blot analysis of phosphorylated p38 in MWCL (n = 5) and HBL-1 (n = 3) A20 knock out cell lines and their wild type counterpart. Total p38 was used as a loading control. Each bar represents the mean values of expression levels ± SD, *p ≤ 0.05, **p ≤ 0.01. c, d MWCL and HBL-1 cell lines were treated with indicated concentrations of ibrutinib or DMSO for 48 h and run in triplicate (n = 3). The representative independent experiment is shown and each point represents the mean normalized counts ± SD

