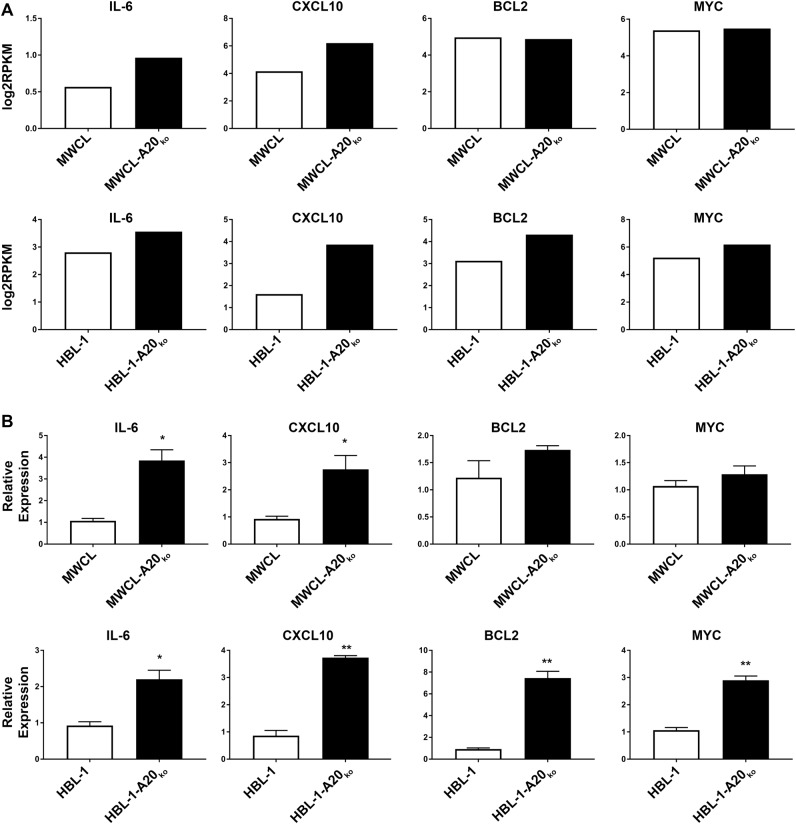
Fig. 3. Upregulation of NF-κB Target gene RNA expression in MWCL-A20ko and HBL-1-A20ko cells.
a Log(2) reads per kilobase per million mapped (RPKM) reads from RNASeq reveals up-regulation of the NF-κB target genes in MWCL-A20ko and HBL-1-A20ko cell lines (n = 1). b Bar graph representing fold increase of NF-κB target genes in MWCL-A20ko (IL-6, n = 6; CXCL10, n = 5; BCL2, n = 3; MYC, n = 3) and HBL-1-A20ko (IL-6, n = 5; CXCL10, n = 3; BCL2, n = 3; MYC, n = 3) cell lines determined by qPCR. The representative independent experiment is shown and all qPCR experiments were performed in duplicates. Each bar represents the mean values of expression levels ± SD. *p ≤ 0.05, **p ≤ 0.01

