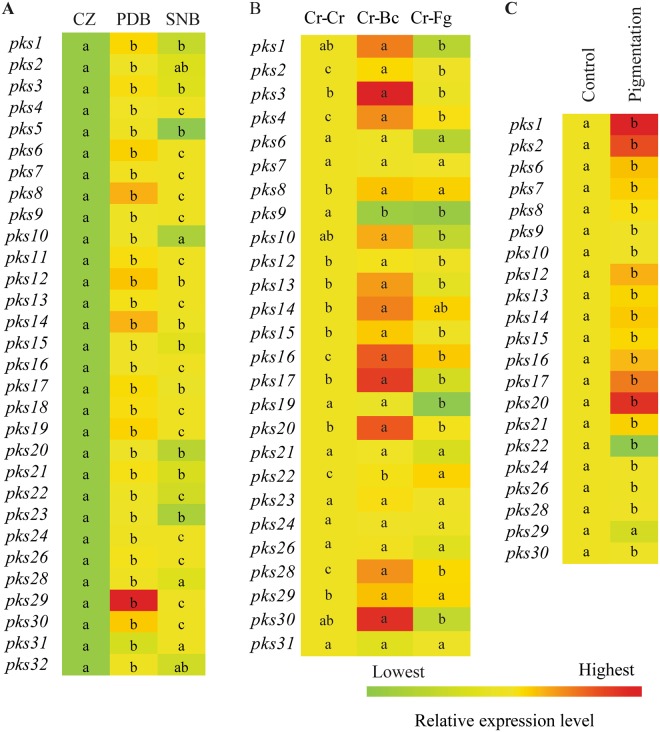
Figure 3.
Heat map of polyketide synthase gene expression in C. rosea. (A) During mycelial growth in liquid CZ, PDB and SNB culture media. C. rosea mycelia grown in CZ medium were used as control treatment. (B) During interactions with itself (Cr-Cr), B. cinerea (Cr-Bc) or F. graminearum (Cr-Fg). C. rosea interaction with self (Cr–Cr) was used as control treatment. (C) During pigment production. Four days old C. rosea culture plates, incubated at the same conditions were used as control treatment as no pigmentation was observed at this stage. Relative expression level based on RT-qPCR was calculated as the ratio between the target PKS gene and β-tubulin using 2−ΔΔCt method (Livak and Schmittgen, 2001), and compared with the respective control. Statistically significant differences (P ≤ 0.05) in gene expression between treatments were determined using Fisher’s exact test and are indicated by different letters. The scale representing the relative expression intensity values is shown.

