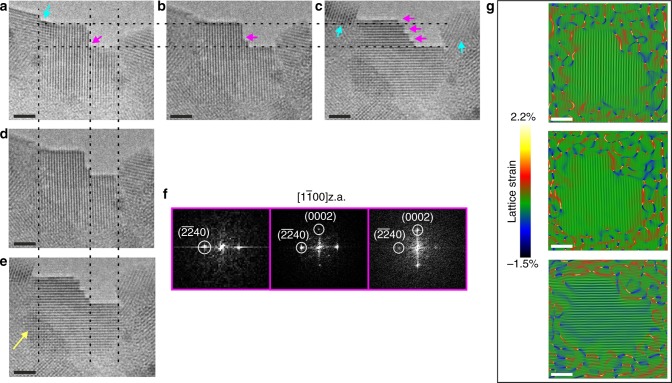
Fig. 3.
Step formation at the growth front. a HRTEM image of a small crystallite viewed along the .z.a. exhibiting a step (magenta arrow). The edges of the crystallite are diffused. b, d Same crystallite (placed inline and underneath (a)) in which an extra step has been formed. c, e Three steps have been formed. The dashed lines act as a guide for the eye, taking as reference the initial crystallite’s step height and width differences. A ~1–2 ML height difference is visible as well as an increase in the width (denoted by the yellow arrow). Cyan arrows denote the adjacent crystallites that have grown as well. f FFT micrographs, from right to left, obtained from the nanocrystals shown in (a, b and c), respectively. g Bragg filtered images obtained from the respective HRTEM micrographs in (a, b and c) using g = and g = 0002 with their corresponding GPA lattice strain maps superimposed, making the boundaries of the crystallite more apparent. Aging time of the sample was 3 weeks. Scale bar in all images, 2 nm

