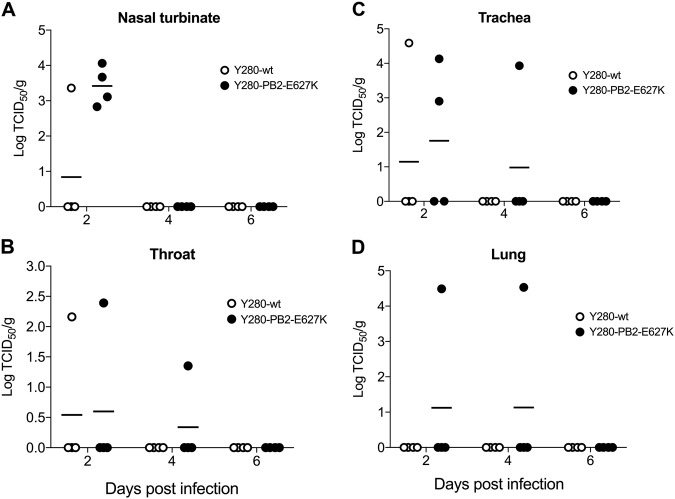
Fig. 2. Viral titers from different tissues of the respiratory tract in tree shrews infected with H9N2 viruses.
Tree shrews (n = 4 per group) were infected with 106 TCID50 of Y280-wt or Y280-PB2-E627K virus. Nasal turbinate (a), throat (b), trachea (c), and lung (d) tissues were collected at 2, 4, and 6 dpi. The supernatant of the tissue homogenate was subjected to a TCID50 assay using MDCK cells. The dots represent the viral titer (log10TCID50 per gram of tissue) of individual animals; the lines indicate the mean value in each group

