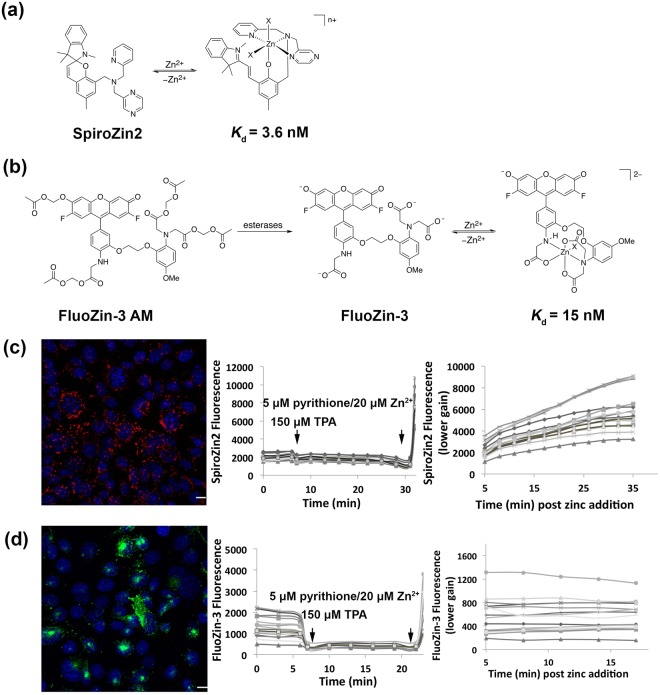
Figure 1.
Titration of probes in HC11 cells. (a) Molecular structure of zinc-unbound and zinc-bound SpiroZin2 λ ex = 520 nm, λ em = 640 nm. (b) Molecular structure of FluoZin-3 AM, zinc-unbound and zinc-bound FluoZin-3, λ ex = 494 nm, λ em = 516 nm. (c) Representative image of SpiroZin2-stained HC11 cells and the titration curve of SpiroZin2 in HC11 cells. Red: SpiroZin2. Blue: nucleus. To avoid saturation of pixels, lower gain was applied to acquire images post zinc addition. (d) Representative image of FluoZin-3-stained HC11 cells and the titration curve of FluoZin-3 in HC11 cells. Green: FluoZin-3. Blue: nucleus. To avoid saturation of pixels, lower gain was applied to acquire images post zinc addition. Scare bar, 10 μm.

