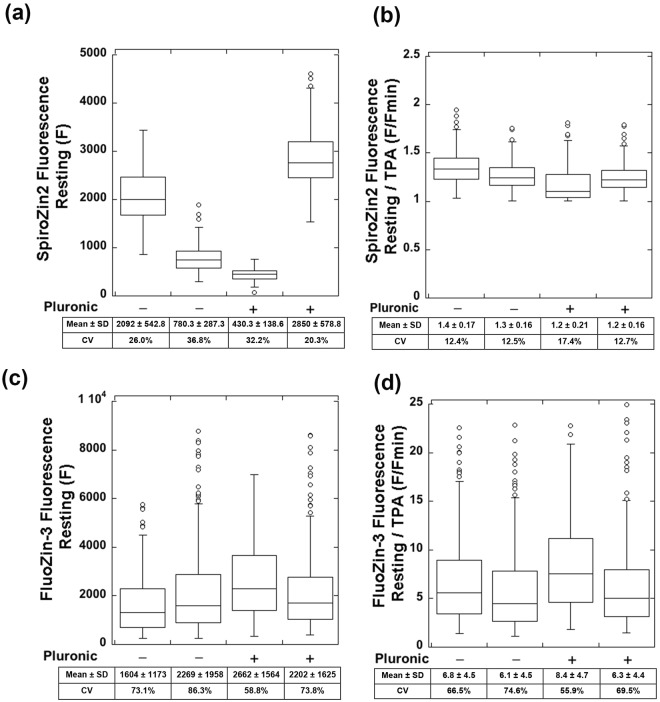
Figure 2.
SpiroZin2 staining yields consistent signals after normalization to TPA treatment whereas FluoZin3-stained cells have highly variable signals. (a) SpiroZin2 fluorescence at resting state with and without the addition of pluronic. (b) SpiroZin2 signal at resting state normalized to TPA treatment with and without the addition of pluronic. (c) FluoZin-3 fluorescence at resting state with and without the addition of pluronic. (d) FluoZin-3 signal at resting state normalized to TPA treatment with and without the addition of pluronic. Normalization to TPA treatment was accomplished by dividing the respective probe fluorescent intensity by the fluorescence intensity upon TPA treatment for each cell. Each point is an individual cell, n > 62 for each sample. Two biological replicates per condition. SD, standard deviation. CV, coefficient of variation.

