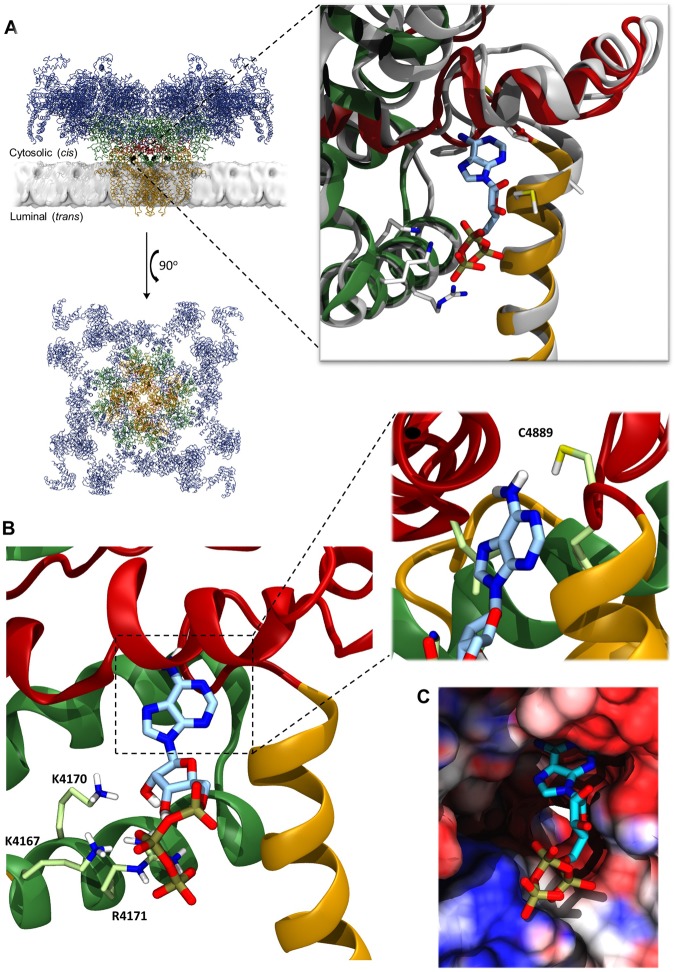
Figure 1.
Comparison of RyR1 and RyR2 at the ATP binding site illustrating key residues for interaction with the ATP molecule. (A) The overall structure of RyR2 (PDB-ID 5GOA) is depicted in cartoon representation, both in the lipid bilayer and from above16. The membrane position was taken from the Orientations of Proteins in Membranes database38. Residues 1–3636 are shown in blue, 3636–4207 in green, 4480–4888 (transmembrane domain) in orange and 4889–4967 (CTD region) in dark red. The suggested ATP binding site in each chain is indicated by four black dots and the inset to the right shows a magnification of one of these sites. Each identical ATP site (inset) consists of a fairly hydrophobic pocket, and a more exposed region lined by positively charged lysine and arginine residues. RyR1 (PDB-ID 5TAS) is shown in grey cartoon representation, with important residues indicated and with ATP in the binding site. RyR2, coloured as above, is overlaid for comparison to illustrate the close similarity with RyR1 at this site. (B) The RyR2 ATP site is further expanded to show the Autodock-predicted pose for ATP which is most similar to the ATP binding mode observed in the RyR1 cryo-EM structure; important residues are indicated. The inset shows an enlarged view of the adenine region with the C4889 residue shown. (C) The RyR1 (PDB-ID 5TAS) ATP site shown in surface representation with an ATP molecule bound. The surface is coloured by the electrostatic potential, going from dark blue (most positive), through white (neutral) to red (negative).

