Figure 4.
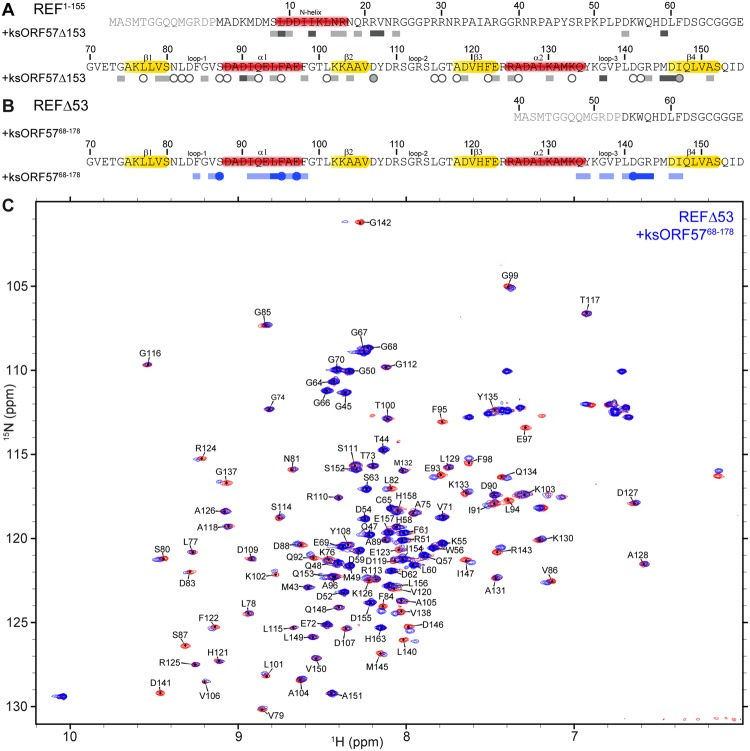
Mapping of ALYREF/REF2-I interaction with KSHV ORF57 by NMR. Perturbations in 15N HSQC spectra were used to map interactions of 15N-labeled REF2-I constructs with unlabeled ksORF57 constructs. (A) Signal shifts and intensity perturbations induced by ksORF57Δ53 on REF1–155 mapped onto its sequence. (B) Signal shifts and intensity perturbations induced by ksORF5768–178 on REFΔ53 mapped onto its sequence. Secondary structure elements are highlighted on the primary sequence; α-helix in red, β-sheet in yellow. Broadened residues indicated by circles and moderate and large shifts indicated by light and dark blocks, respectively. (C) Example spectrum of free 15N labeled REFFΔ53 (red) is overlaid with spectrum upon addition of ksORF5768–178 (blue) shows spectral perturbations assigned to RRM region of REF2-I.

