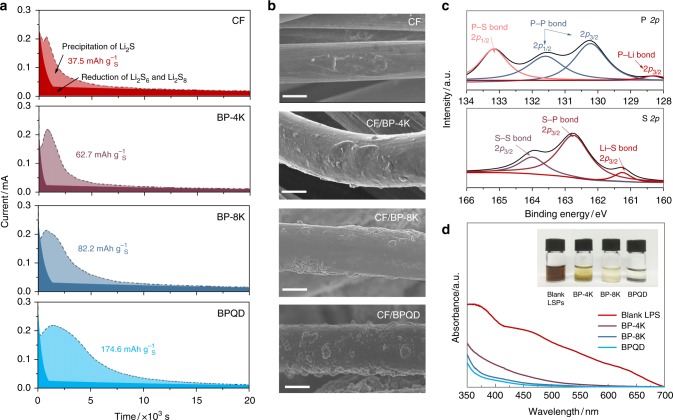
Fig. 2.
Black phosphorus flakes for lithium polysufide conversion and adsorption. a Potentiostatic discharge curves of Li2S8 tetraglyme solution on different substrates at 2.05 V. The dark/light colors indicate the reduction of Li2S8/Li2S6 and the precipitation of Li2S, respectively. b scanning electron microscopy (SEM) images showing the precipitation of Li2S on different substrates as indicated in a, c X-ray photoelectron spectroscopy (XPS) spectra for P 2p and S 2p of the black phosphorus (BP) flakes adsorbed with lithium polysulfides (LiPSs), d ultraviolet–visible (UV–vis) spectra of LiPS with variation in color upon adsorption by different-sized BP flakes. Scale bar, 5 µm (b). (CF is carbon fiber, BP-4K is BP that was centrifuged at 4000 rpm, BP-8K was centrifuged at 8000 rpm, BPQD is black phosphorus quantum dot)

