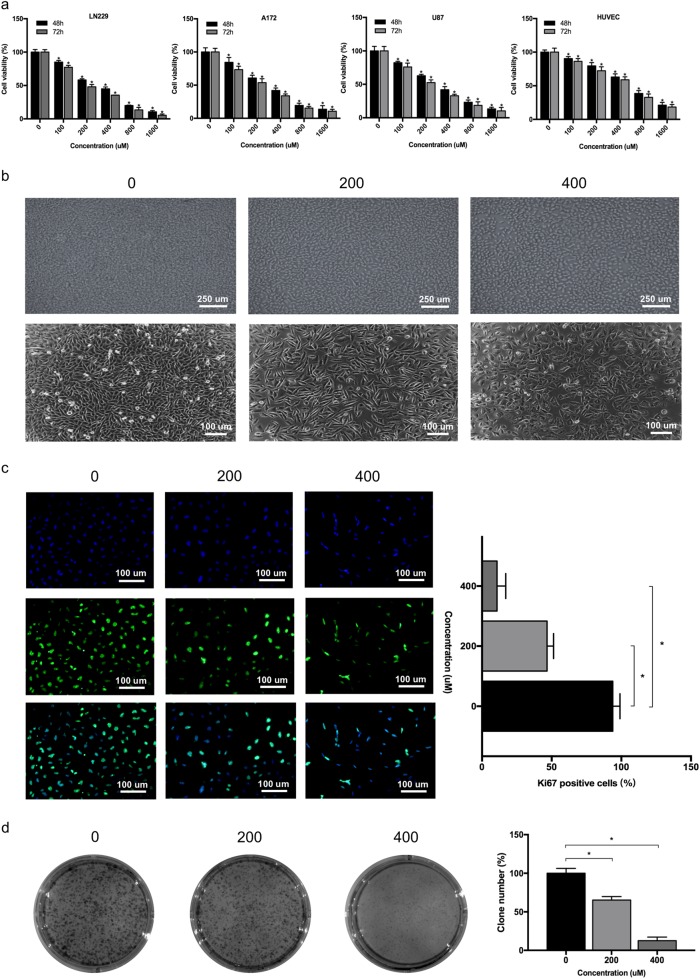
Fig. 1. NTZ inhibits glioma cell growth in vitro.
a Cell viability of LN229, A172, U87, and HUVECs determined by MTT assays after 48 h and 72 h of NTZ treatment. b Phase contrast microscopy of LN229 cells inhibited by NTZ. Scale bar represents 100 or 250 μm. c Fluorescence microscopy of Ki67 expression after treatment of the LN229 cell line with NTZ at concentrations of 0, 200, and 400 μM for 48 h. Scale bar represents 100 μM. d Colony formation assays of LN229 cells treated with 0, 200, and 400 μM NTZ. The experiments were repeated 3 times independently, and the bars represent SD. The data were normalized with control group (*P < 0.05)

