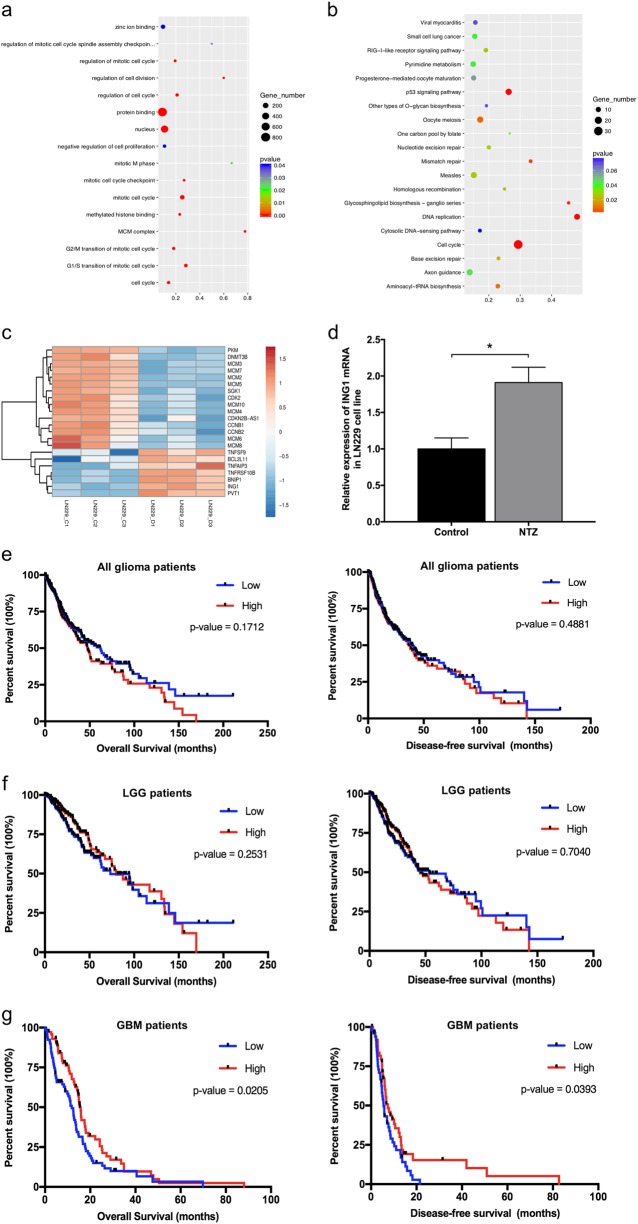
Fig. 2. Identification of therapeutic targets after NTZ treatment and survival analysis of ING1 in glioma patients.
a–b GO and KEGG analysis of significant target genes. c Heatmap of altered genes after NTZ treatment. d The relative expression of ING1 in LN229 cells after 48 h NTZ treatment. The experiments were repeated 3 times independently, and the bars represent SD. The data were normalized with control group (*P < 0.05). e Kaplan–Meier survival analysis of ING1 for all glioma patients (662 glioma tissue samples). f Kaplan–Meier survival analysis of ING1 for LGG glioma patients (510 LGG tissue samples). Low-grade glioma LGG. g Kaplan–Meier survival analysis of ING1 for GBM patients (152 GBM tissue samples)

