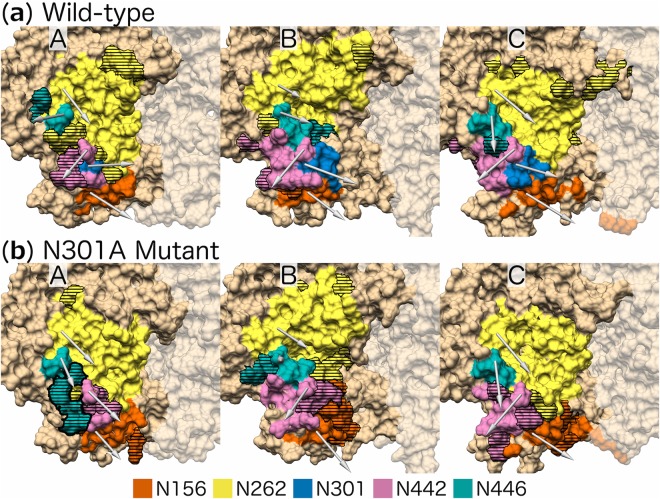
Figure 5.
Neighbourhoods of the (a) wild-type and (b) N301A mutant glycans nearest to the V3 sub-region for the three protomers (A, B, C): glycans N156 (orange), N262 (yellow), N301 (blue, only present in the wild-type), N442 (pink), and N446 (green). Horizontal lines represent residues that are in different neighbourhoods when comparing the wild-type and N301A mutant. The arrows originate from the Cα atom of the Asn and end at the average centre of mass position for the selected glycans. The representations are cropped around the V3 region of each protomer and the surface representation of residues on adjacent protomers are shown as opaque.

