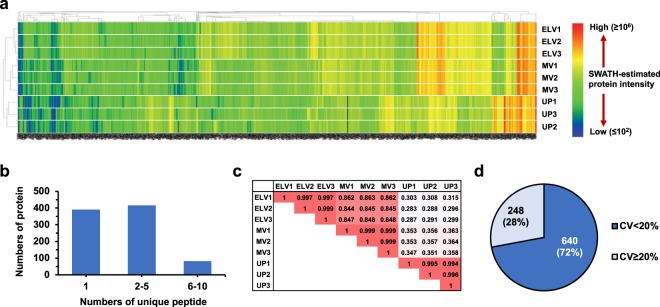
Figure 3.
Performance of the ELV-SWATH-MS workflow. (a) Quantitative data of 888 proteins in ELVs, MVs and UP samples (3 replicates for each sample) were demonstrated in a heat map manner. The scale of SWATH-estimated protein intensity showed the relative amount of original data after Total Area Sum (TAS) normalization. The missing values (6 out of 7,992 data across all replicates) were labeled in black color. (b) Numbers of unique peptide per protein. (c) Pearson correlation of nine sample replicates based on 888 expression data. Each number in the sample matrix was the correlation coefficient (r), in which r = 1 was a perfect positive relationship, and r = 0 showed no association between a sample pair. (d) The coefficient of variation (CV) of 888 protein quantitation in urinary ELVs, in which the median-CV was 7.7%.

