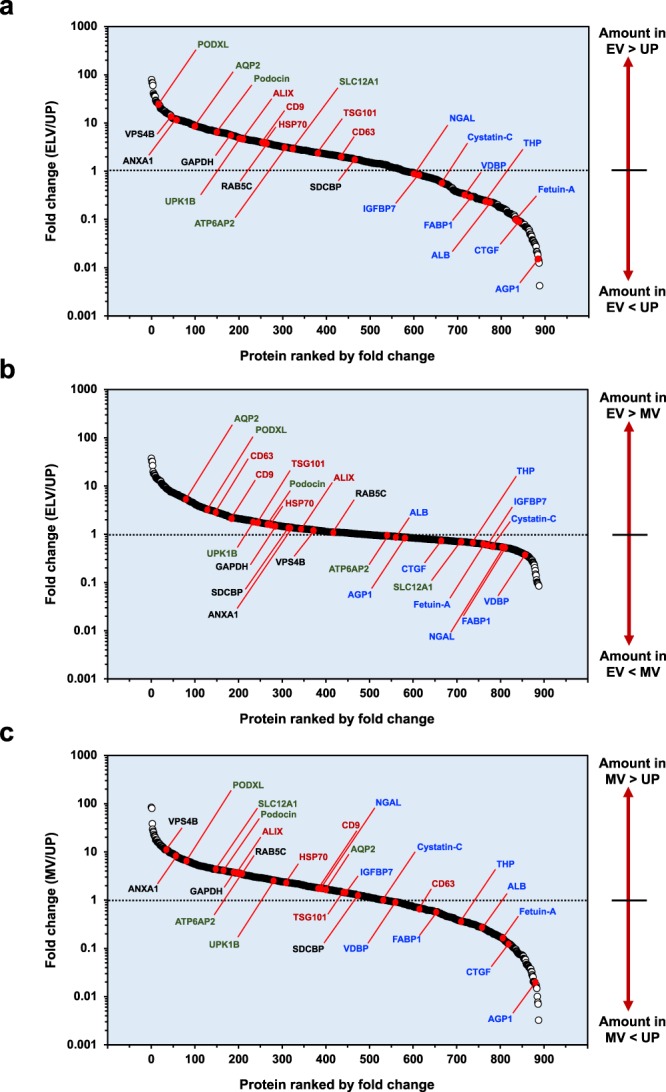
Figure 4.

Protein enrichment analysis. Mean values of protein expression was used to calculate fold change (FC) of particular proteins between ELV-UP (a), ELV-MV (b) and MV-UP (c), in which FC >1, <1, and = 1 indicated enrichment, depletion and no change, respectively. Selected biomarkers were labeled to facilitate visual interpretation. Common exosome markers were marked in red color. Tissue-localized markers were labeled in green color. Exosome-associated proteins were labeled in black color. Selected urine biomarkers were labeled in blue color.
